Bitcoin failed to gain pace above $40,700 and declined against the US Dollar. BTC traded to a new weekly low and might struggle to climb above $39,200.
Bitcoin started a fresh decline after it failed to clear the key $40,700 resistance zone.
The price is now back below $39,000 and the 100 hourly simple moving average.
There was a break below a connecting bullish trend line with support near $39,500 on the hourly chart of the BTC/USD pair (data feed from Kraken).
The pair could correct higher, but upsides might be capped near $38,800 or $39,200.
Bitcoin Price Declines Sharply
Bitcoin price attempted a clear move above the $40,500 level. However, BTC failed to clear the $40,700 and $40,750 resistance levels.
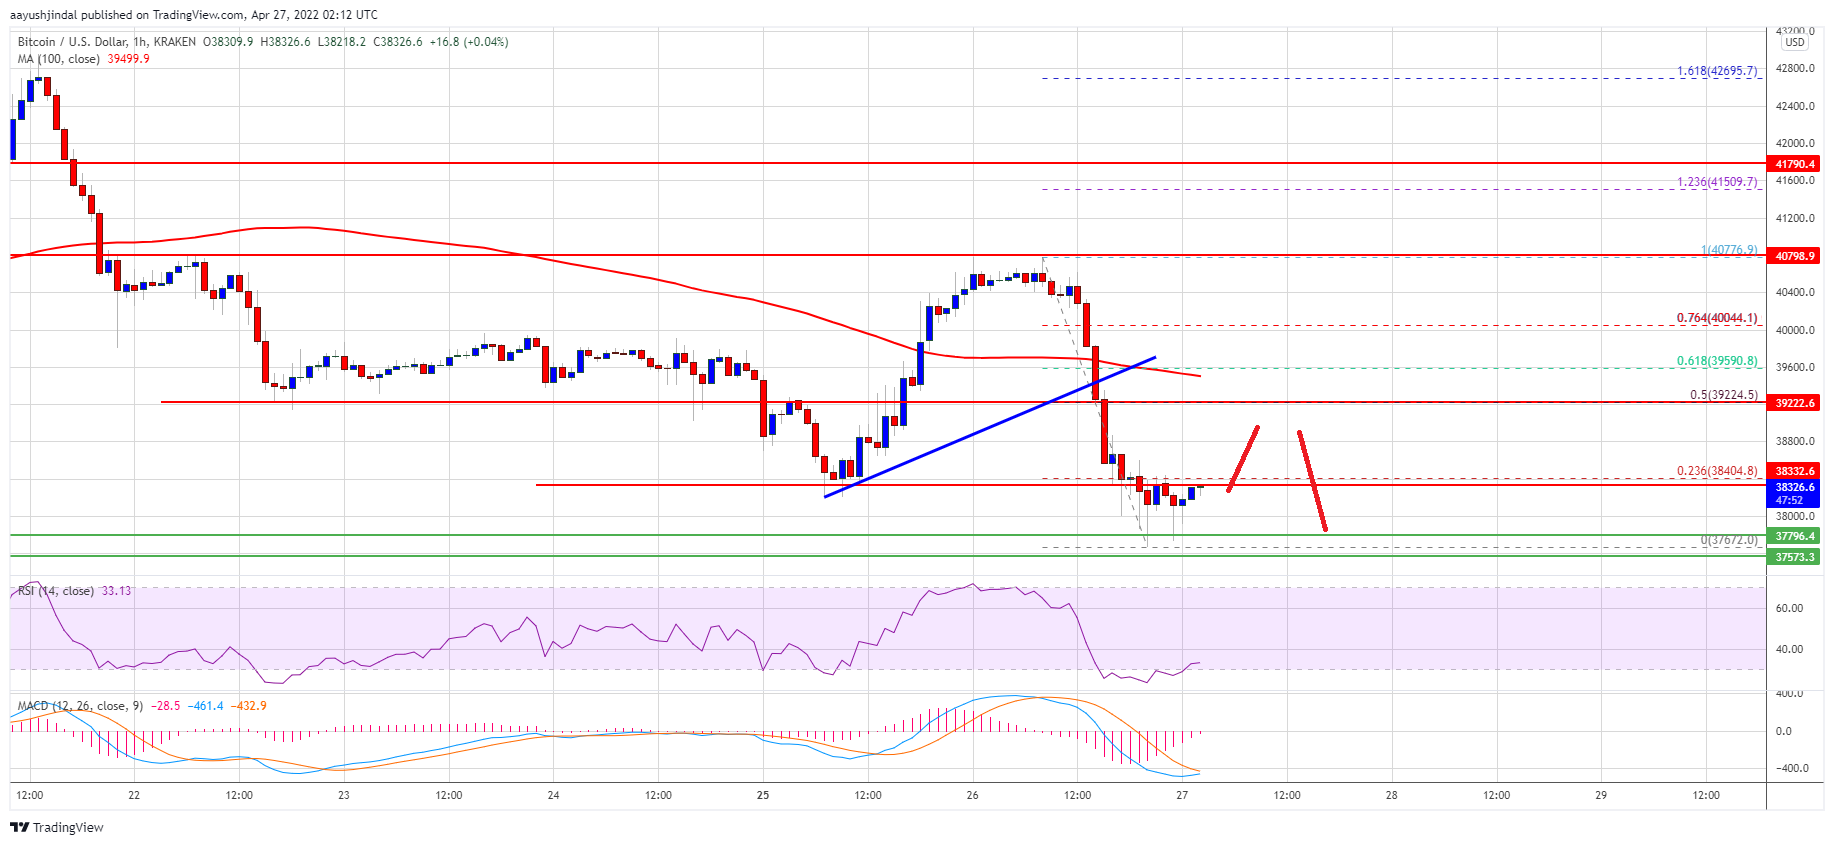
A high was formed near $40,776 and the price reacted to the downside. There was a sharp decline below the $40,000 level and the 100 hourly simple moving average. Besides, there was a break below a connecting bullish trend line with support near $39,500 on the hourly chart of the BTC/USD pair.
Bitcoin is now back below $39,000 and the 100 hourly simple moving average. It traded as low as $37,672 and is currently consolidating losses.
It is testing the 23.6% Fib retracement level of the recent decline from the $40,776 swing high to $37,672 low. An immediate resistance on the upside is near the $38,800 level. The next key resistance could be near the $39,200 zone.
The 50% Fib retracement level of the recent decline from the $40,776 swing high to $37,672 low is also near the $39,250 zone. The main resistance is now forming near the $39,550 level and the 100 hourly simple moving average.
Source: BTCUSD on TradingView.com
If there is a clear move above the $39,200 and $39,550 levels, the price could start a decent increase. In the stated case, the price could even surpass the $40,000 resistance. The next major resistance may perhaps be near the $40,700 zone.
More Losses in BTC?
If bitcoin fails to clear the $39,200 resistance zone, it could continue to move down. An immediate support on the downside is near the $37,650 level.
The next major support is seen near the $37,500 level. A close below the $37,500 support zone might start another decline. In the stated case, the price might drop to $36,200.
Technical indicators:
Hourly MACD – The MACD is slowly losing pace in the bearish zone.
Hourly RSI (Relative Strength Index) – The RSI for BTC/USD is now well below the 50 level.
Major Support Levels – $37,650, followed by $37,500.
Major Resistance Levels – $39,200, $39,550 and $40,000.
Bitcoin failed to gain pace above $40,700 and declined against the US Dollar. BTC traded to a new weekly low and might struggle to climb above $39,200.
Bitcoin started a fresh decline after it failed to clear the key $40,700 resistance zone.
The price is now back below $39,000 and the 100 hourly simple moving average.
There was a break below a connecting bullish trend line with support near $39,500 on the hourly chart of the BTC/USD pair (data feed from Kraken).
The pair could correct higher, but upsides might be capped near $38,800 or $39,200.
Bitcoin price attempted a clear move above the $40,500 level. However, BTC failed to clear the $40,700 and $40,750 resistance levels.
A high was formed near $40,776 and the price reacted to the downside. There was a sharp decline below the $40,000 level and the 100 hourly simple moving average. Besides, there was a break below a connecting bullish trend line with support near $39,500 on the hourly chart of the BTC/USD pair.
Bitcoin is now back below $39,000 and the 100 hourly simple moving average. It traded as low as $37,672 and is currently consolidating losses.
It is testing the 23.6% Fib retracement level of the recent decline from the $40,776 swing high to $37,672 low. An immediate resistance on the upside is near the $38,800 level. The next key resistance could be near the $39,200 zone.
The 50% Fib retracement level of the recent decline from the $40,776 swing high to $37,672 low is also near the $39,250 zone. The main resistance is now forming near the $39,550 level and the 100 hourly simple moving average.
Source: BTCUSD on TradingView.com
If there is a clear move above the $39,200 and $39,550 levels, the price could start a decent increase. In the stated case, the price could even surpass the $40,000 resistance. The next major resistance may perhaps be near the $40,700 zone.
If bitcoin fails to clear the $39,200 resistance zone, it could continue to move down. An immediate support on the downside is near the $37,650 level.
The next major support is seen near the $37,500 level. A close below the $37,500 support zone might start another decline. In the stated case, the price might drop to $36,200.
Technical indicators:
Hourly MACD – The MACD is slowly losing pace in the bearish zone.
Hourly RSI (Relative Strength Index) – The RSI for BTC/USD is now well below the 50 level.
Major Support Levels – $37,650, followed by $37,500.
Major Resistance Levels – $39,200, $39,550 and $40,000.
Tags: bitcoinbtcusdBTCUSDTxbtusd
FeedzyRead More
Bessent said the U.S. Treasury Department will provide temporary authorization to allow countries to purchase…
Bitcoin Magazine Strategy (MSTR) Bought Over 4,000 Bitcoin Today via STRC As Strong Week Continues…
Bitcoin Magazine David Bailey Confirmed As A Bitcoin 2026 Speaker David Bailey has been officially…
Bitcoin Magazine Paraguay Adopts Stricter Crypto Oversight, Mandates Detailed Transaction on Bitcoin Reporting Paraguay’s National…
Bitcoin Magazine Policy Group Calls for Bitcoin Inclusion in Proposed Crypto Tax Exemption The Bitcoin…
Bitcoin Magazine Corporate Bitcoin Holdings Hit Record High as Institutions Accumulate 2.8x Mining Supply: Report…