Bitcoin is trading in a bearish zone below $19,500 against the US Dollar. BTC might start a sharp recovery wave if there is a move above the $19,500 resistance.
Bitcoin failed to gain pace above the $19,500 and $19,600 resistance levels.
The price is now trading below the $20,000 level and the 100 hourly simple moving average.
There is a crucial bearish trend line forming with resistance near $19,500 on the hourly chart of the BTC/USD pair (data feed from Kraken).
The pair could start a fresh decline unless there is a move above the $19,500 resistance zone.
Bitcoin Price Eyes Upside Break
Bitcoin price started another decline below the $19,500 support zone. The price even traded below the $19,000 support zone and spiked below the $18,800 level.
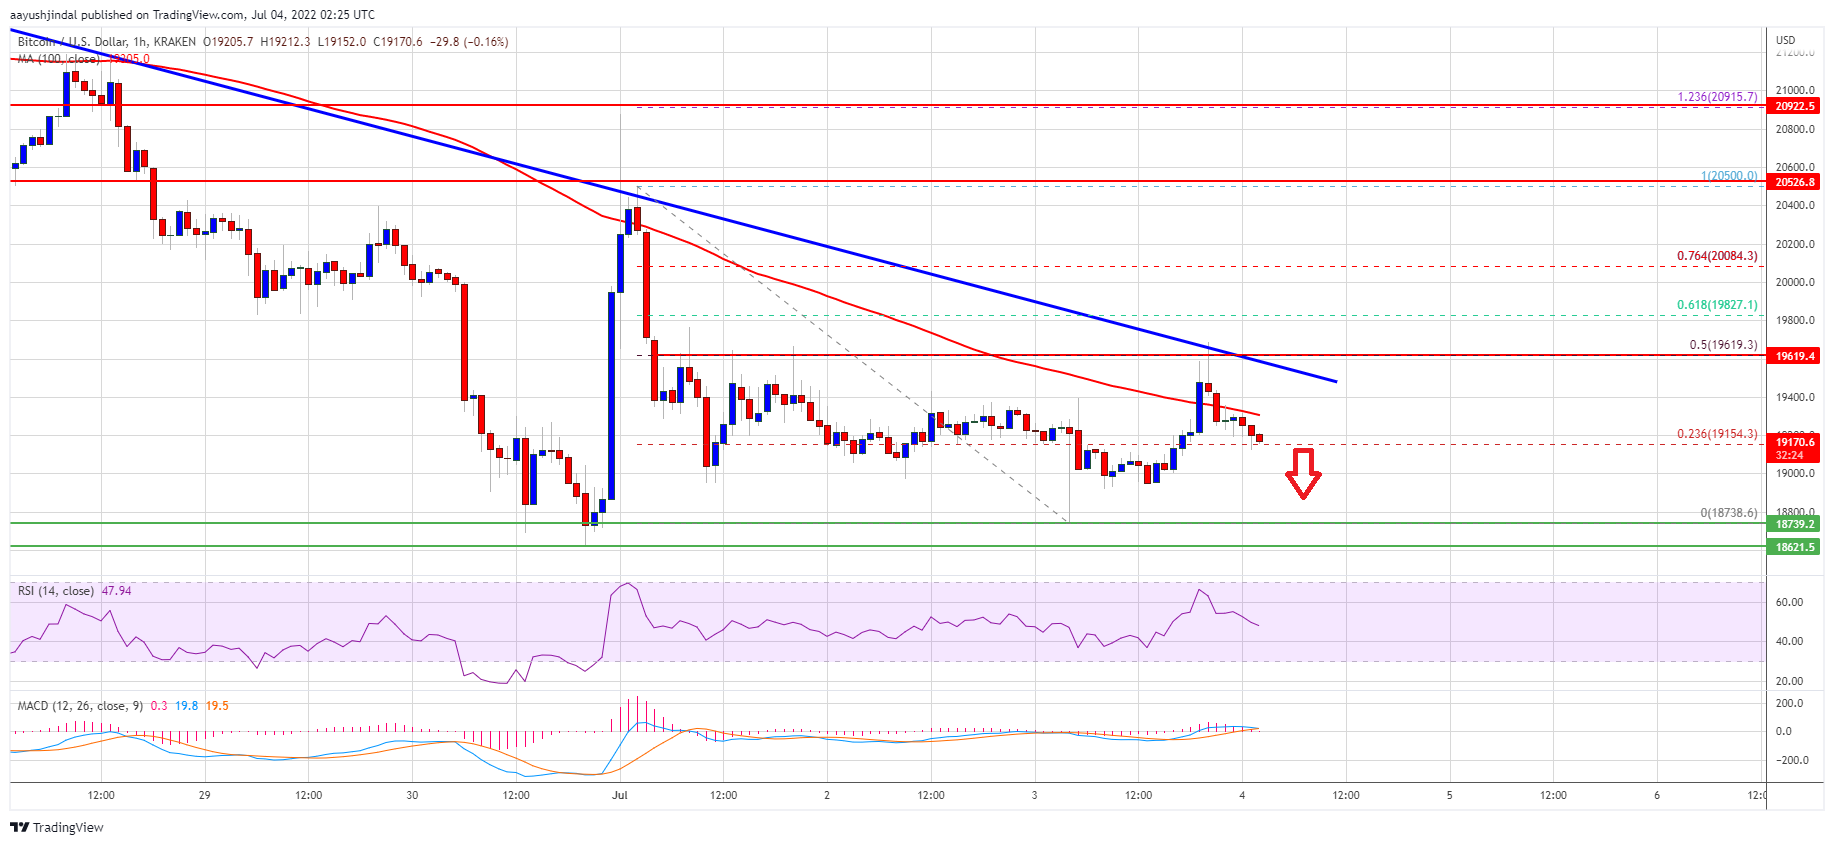
A low was formed near $18,738 and the price is now consolidating losses. There was a minor upward move above the $19,000 resistance zone. The price climbed above the 23.6% Fib retracement level of the recent decline from the $20,500 swing high to $18,738 low.
However, the price is now facing a strong resistance near the $19,400 zone and the 100 hourly simple moving average. There is also a crucial bearish trend line forming with resistance near $19,500 on the hourly chart of the BTC/USD pair.
The trend line is close to the 50% Fib retracement level of the recent decline from the $20,500 swing high to $18,738 low.
Source: BTCUSD on TradingView.com
The next key resistance is near the $19,800 zone. A clear move above the trend line resistance and then $19,800 could push the price further higher. In the stated case, the price could rise towards the $20,500 level. The next major resistance sits near the $21,200 level.
Fresh Decline in BTC?
If bitcoin fails to clear the $19,500 resistance zone, it could start another decline. An immediate support on the downside is near the $19,000 level.
The next major support now sits near the $18,700 level, below which the price could decline heavily. In the stated case, the price may perhaps decline towards the $17,500 level.
Technical indicators:
Hourly MACD – The MACD is now losing pace in the bullish zone.
Hourly RSI (Relative Strength Index) – The RSI for BTC/USD is now below the 50 level.
Major Support Levels – $19,000, followed by $18,700.
Major Resistance Levels – $19,500, $19,800 and $20,500.
Bitcoin is trading in a bearish zone below $19,500 against the US Dollar. BTC might start a sharp recovery wave if there is a move above the $19,500 resistance.
Bitcoin failed to gain pace above the $19,500 and $19,600 resistance levels.
The price is now trading below the $20,000 level and the 100 hourly simple moving average.
There is a crucial bearish trend line forming with resistance near $19,500 on the hourly chart of the BTC/USD pair (data feed from Kraken).
The pair could start a fresh decline unless there is a move above the $19,500 resistance zone.
Bitcoin price started another decline below the $19,500 support zone. The price even traded below the $19,000 support zone and spiked below the $18,800 level.
A low was formed near $18,738 and the price is now consolidating losses. There was a minor upward move above the $19,000 resistance zone. The price climbed above the 23.6% Fib retracement level of the recent decline from the $20,500 swing high to $18,738 low.
However, the price is now facing a strong resistance near the $19,400 zone and the 100 hourly simple moving average. There is also a crucial bearish trend line forming with resistance near $19,500 on the hourly chart of the BTC/USD pair.
The trend line is close to the 50% Fib retracement level of the recent decline from the $20,500 swing high to $18,738 low.
Source: BTCUSD on TradingView.com
The next key resistance is near the $19,800 zone. A clear move above the trend line resistance and then $19,800 could push the price further higher. In the stated case, the price could rise towards the $20,500 level. The next major resistance sits near the $21,200 level.
If bitcoin fails to clear the $19,500 resistance zone, it could start another decline. An immediate support on the downside is near the $19,000 level.
The next major support now sits near the $18,700 level, below which the price could decline heavily. In the stated case, the price may perhaps decline towards the $17,500 level.
Technical indicators:
Hourly MACD – The MACD is now losing pace in the bullish zone.
Hourly RSI (Relative Strength Index) – The RSI for BTC/USD is now below the 50 level.
Major Support Levels – $19,000, followed by $18,700.
Major Resistance Levels – $19,500, $19,800 and $20,500.
Tags: bitcoinbtcusdBTCUSDTxbtusd
FeedzyRead More
Your day-ahead look for May 26, 2026Read MoreCoinDesk: Bitcoin, Ethereum, Crypto News and Price Data[#item_full_content]
The bitcoin price chart is forming a potential lower high while ether languishes in a…
Heavy supply concentration and large options positioning continue to suppress volatility and keep bitcoin range-bound.Read…
As Bitcoin (BTC) recovers from its recent drop below the $75,000 support, some market observers…
Bitcoin’s recent drop below key support may have been more than just a bearish breakdown.…
Enflux says “the bid is there” but no one is adding size, while Glassnode data…