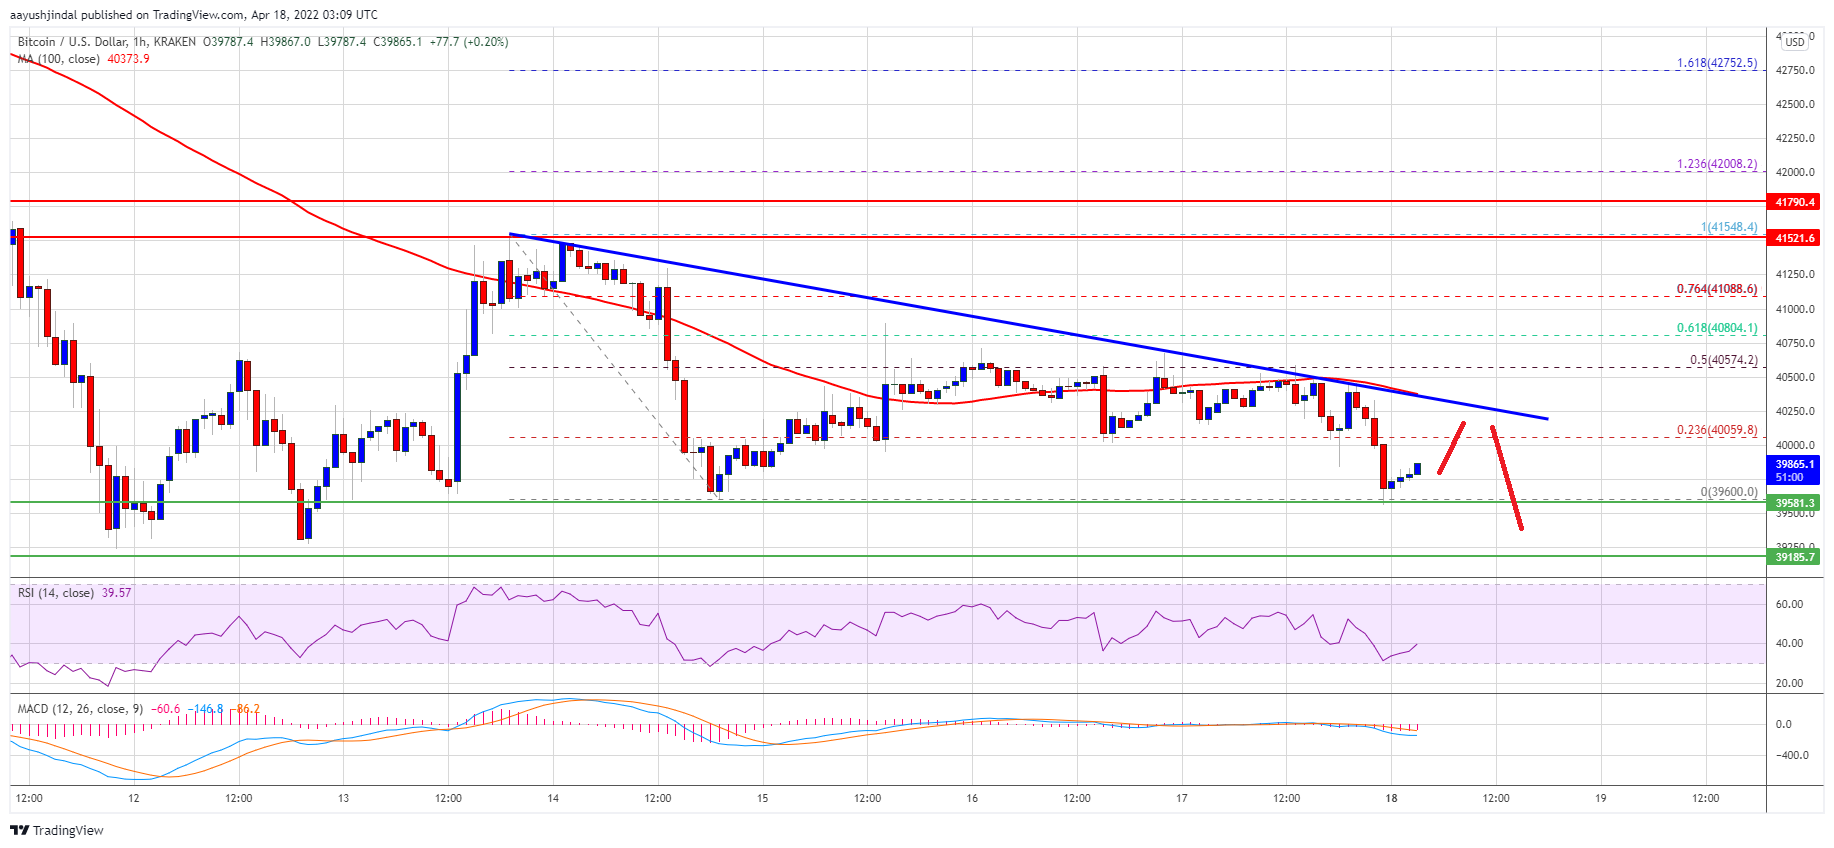
Bitcoin is still struggling below $41,500 against the US Dollar. BTC remains at a risk of more downsides below the $39,000 support zone.
Bitcoin is showing bearish signs below the $40,500 and $41,500.
The price is now trading below $40,500 and the 100 hourly simple moving average.
There is a key bearish trend line forming with resistance near $40,180 on the hourly chart of the BTC/USD pair (data feed from Kraken).
The pair could extend decline if there is a clear move below the $39,000 support zone.
Bitcoin Price Resumes Decline
Bitcoin price remained below the key $41,500 resistance zone. BTC seems to be trading in a range above the $39,000 level and below the $41,500 resistance zone.
The last swing low was formed near $39,600 before the price started an upside correction. There was a move above the $40,000 resistance zone. The price climbed above the 23.6% Fib retracement level of the downward move from the $41,548 swing high to $39,600 low.
However, the price faced a strong resistance near the $40,500 level and the 100 hourly simple moving average. Bitcoin also struggled near the 50% Fib retracement level of the downward move from the $41,548 swing high to $39,600 low.
There is also a key bearish trend line forming with resistance near $40,180 on the hourly chart of the BTC/USD pair. An immediate resistance on the upside is near the $40,200 level.
Source: BTCUSD on TradingView.com
The next key resistance could be $40,380 and the 100 hourly SMA. To start a recovery wave, the price must clear the $40,380 zone and the 100 hourly SMA. In the stated case, the price may perhaps rise towards the $40,850 resistance zone. Any more gains could set the pace for a move towards the main $41,500 hurdle in the near term.
More Losses in BTC?
If bitcoin fails to clear the $40,180 resistance zone, it could start another decline. An immediate support on the downside is near the $39,600 level.
The next major support is seen near the $39,180 level. A downside break below the $39,180 support zone could accelerate losses. In the stated case, the price could decline towards the $38,800 level or even $38,500.
Technical indicators:
Hourly MACD – The MACD is now losing pace in the bearish zone.
Hourly RSI (Relative Strength Index) – The RSI for BTC/USD is now below the 50 level.
Major Support Levels – $39,600, followed by $39,180.
Major Resistance Levels – $40,180, $40,400 and $41,500.
Bitcoin is still struggling below $41,500 against the US Dollar. BTC remains at a risk of more downsides below the $39,000 support zone.
Bitcoin is showing bearish signs below the $40,500 and $41,500.
The price is now trading below $40,500 and the 100 hourly simple moving average.
There is a key bearish trend line forming with resistance near $40,180 on the hourly chart of the BTC/USD pair (data feed from Kraken).
The pair could extend decline if there is a clear move below the $39,000 support zone.
Bitcoin price remained below the key $41,500 resistance zone. BTC seems to be trading in a range above the $39,000 level and below the $41,500 resistance zone.
The last swing low was formed near $39,600 before the price started an upside correction. There was a move above the $40,000 resistance zone. The price climbed above the 23.6% Fib retracement level of the downward move from the $41,548 swing high to $39,600 low.
However, the price faced a strong resistance near the $40,500 level and the 100 hourly simple moving average. Bitcoin also struggled near the 50% Fib retracement level of the downward move from the $41,548 swing high to $39,600 low.
There is also a key bearish trend line forming with resistance near $40,180 on the hourly chart of the BTC/USD pair. An immediate resistance on the upside is near the $40,200 level.
Source: BTCUSD on TradingView.com
The next key resistance could be $40,380 and the 100 hourly SMA. To start a recovery wave, the price must clear the $40,380 zone and the 100 hourly SMA. In the stated case, the price may perhaps rise towards the $40,850 resistance zone. Any more gains could set the pace for a move towards the main $41,500 hurdle in the near term.
If bitcoin fails to clear the $40,180 resistance zone, it could start another decline. An immediate support on the downside is near the $39,600 level.
The next major support is seen near the $39,180 level. A downside break below the $39,180 support zone could accelerate losses. In the stated case, the price could decline towards the $38,800 level or even $38,500.
Technical indicators:
Hourly MACD – The MACD is now losing pace in the bearish zone.
Hourly RSI (Relative Strength Index) – The RSI for BTC/USD is now below the 50 level.
Major Support Levels – $39,600, followed by $39,180.
Major Resistance Levels – $40,180, $40,400 and $41,500.
Tags: bitcoinbtcusdBTCUSDTxbtusd
FeedzyRead More
BitMEX is facing a proposed class action in the Southern District of New York seeking…
Bitcoin Magazine Morgan Stanley Bitcoin ETF Nearly Notches $400M in Assets Wall Street giant Morgan…
Poolin Technology has filed for Chapter 11 bankruptcy protection, setting up an orderly wind-down and…
Bitcoin Magazine State Department to Debut Freedom Tech Program with Bitcoin Policy Institute, Palantir as…
Elliptic has published a new report explaining how Bitcoin ATM scams work, and the most…
Michael Saylor's Strategy — under continued pressure in this crypto bear market — released a…