Bitcoin started an upside correction from the $17,600 zone against the US Dollar. BTC is now facing a strong resistance near $20,500 and $21,000.
Bitcoin was able to recover losses from the $17,600 support zone.
The price is now still below the $20,000 level and the 100 hourly simple moving average.
There was a break above a key bearish trend line with resistance near $19,200 on the hourly chart of the BTC/USD pair (data feed from Kraken).
The pair remains at a risk of a fresh decline unless it settles above the $21,000 resistance zone.
Bitcoin Price Eyes Steady Recovery
Bitcoin price followed a bearish path and declined sharply below the $20,000 support zone. It declined over 10% and even spiked below the $18,000 level.
A low was formed near $17,600 before the price started an upside correction. There was a recovery wave above the $18,000 and $18,500 resistance levels. Besides, there was a break above a key bearish trend line with resistance near $19,200 on the hourly chart of the BTC/USD pair.
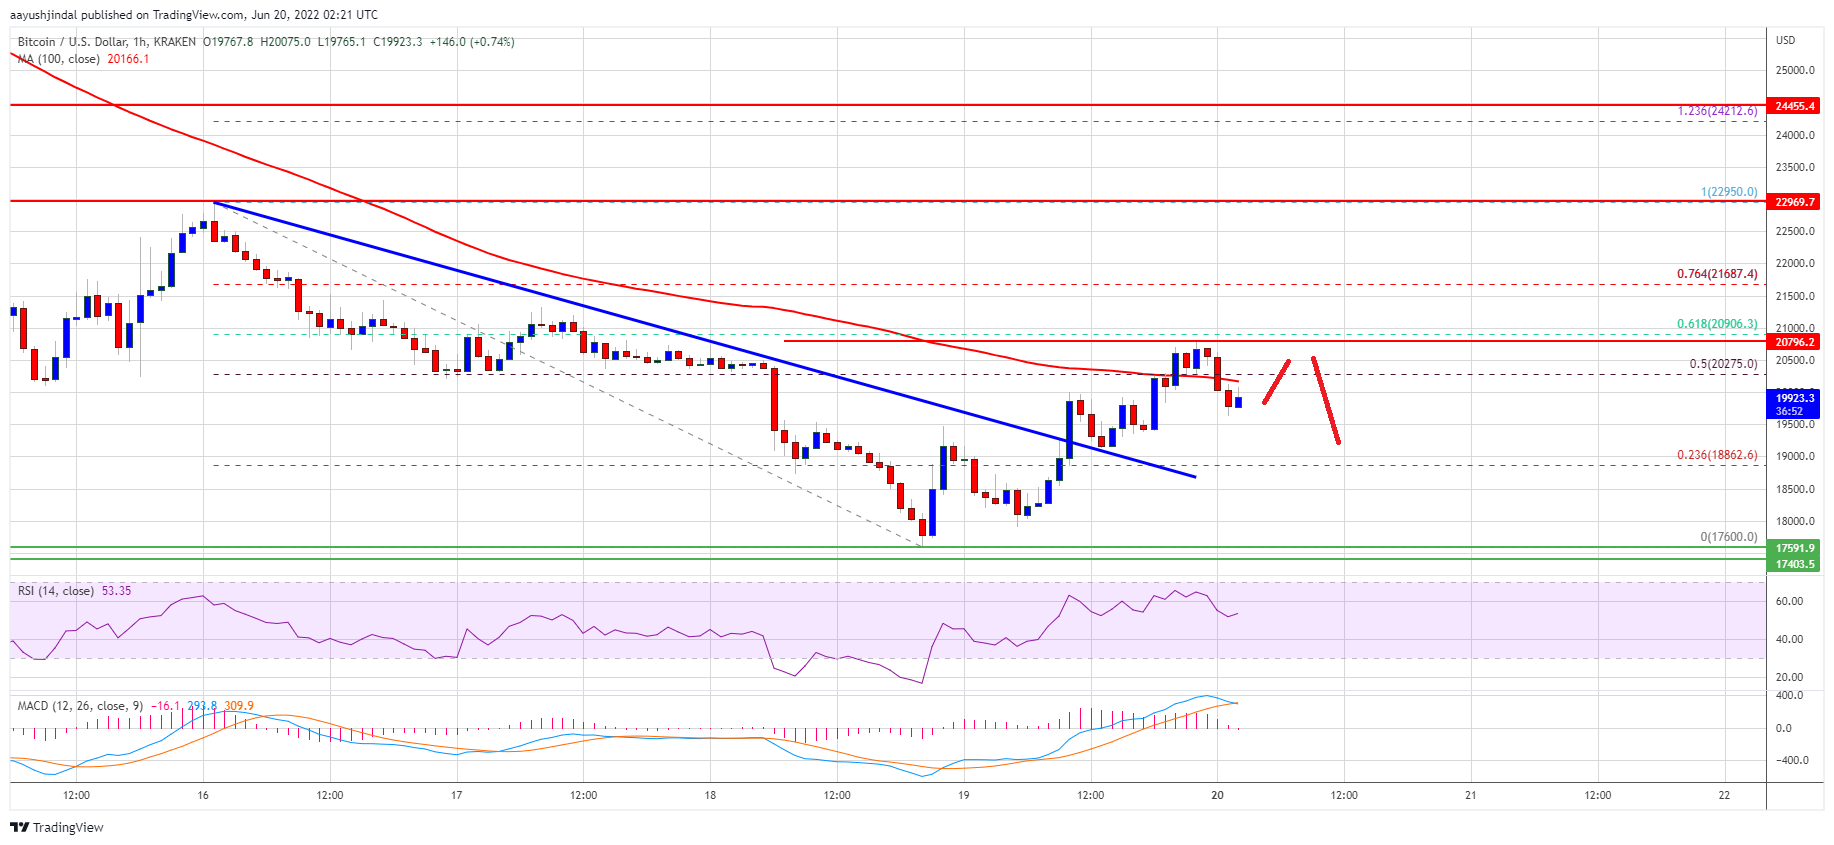
Bitcoin climbed above the 50% Fib retracement level of the key decline from the $22,950 high to $17,600 low. The price even spiked above the $20,000 level and the 100 hourly simple moving average.
However, the bears were active near the $20,500 and $20,750 levels. The 61.8% Fib retracement level of the key decline from the $22,950 high to $17,600 low also acted as a resistance. The price is now trading below the $20,000 level and the 100 hourly simple moving average.
Source: BTCUSD on TradingView.com
An immediate resistance on the upside is near the $20,200 level. The first major resistance is near the $20,500 level. Any more gains might send the price towards the $21,000 level. A close above the $21,000 level could set the pace for a larger increase.
Fresh Decline in BTC?
If bitcoin fails to clear the $20,500 resistance zone, it could start a fresh decline. An immediate support on the downside is near the $19,500 level.
The next major support is near the $18,800 level. A downside break below the $18,800 support could spark a sharp decline. In the stated case, the price could test $17,600.
Technical indicators:
Hourly MACD – The MACD is now losing pace in the bullish zone.
Hourly RSI (Relative Strength Index) – The RSI for BTC/USD is now just above the 50 level.
Major Support Levels – $19,500, followed by $18,800.
Major Resistance Levels – $20,200, $20,500 and $21,000.
Bitcoin started an upside correction from the $17,600 zone against the US Dollar. BTC is now facing a strong resistance near $20,500 and $21,000.
Bitcoin was able to recover losses from the $17,600 support zone.
The price is now still below the $20,000 level and the 100 hourly simple moving average.
There was a break above a key bearish trend line with resistance near $19,200 on the hourly chart of the BTC/USD pair (data feed from Kraken).
The pair remains at a risk of a fresh decline unless it settles above the $21,000 resistance zone.
Bitcoin price followed a bearish path and declined sharply below the $20,000 support zone. It declined over 10% and even spiked below the $18,000 level.
A low was formed near $17,600 before the price started an upside correction. There was a recovery wave above the $18,000 and $18,500 resistance levels. Besides, there was a break above a key bearish trend line with resistance near $19,200 on the hourly chart of the BTC/USD pair.
Bitcoin climbed above the 50% Fib retracement level of the key decline from the $22,950 high to $17,600 low. The price even spiked above the $20,000 level and the 100 hourly simple moving average.
However, the bears were active near the $20,500 and $20,750 levels. The 61.8% Fib retracement level of the key decline from the $22,950 high to $17,600 low also acted as a resistance. The price is now trading below the $20,000 level and the 100 hourly simple moving average.
Source: BTCUSD on TradingView.com
An immediate resistance on the upside is near the $20,200 level. The first major resistance is near the $20,500 level. Any more gains might send the price towards the $21,000 level. A close above the $21,000 level could set the pace for a larger increase.
If bitcoin fails to clear the $20,500 resistance zone, it could start a fresh decline. An immediate support on the downside is near the $19,500 level.
The next major support is near the $18,800 level. A downside break below the $18,800 support could spark a sharp decline. In the stated case, the price could test $17,600.
Technical indicators:
Hourly MACD – The MACD is now losing pace in the bullish zone.
Hourly RSI (Relative Strength Index) – The RSI for BTC/USD is now just above the 50 level.
Major Support Levels – $19,500, followed by $18,800.
Major Resistance Levels – $20,200, $20,500 and $21,000.
Tags: bitcoinbtcusdBTCUSDTxbtusd
FeedzyRead More
A tiny Strategy sale raised a bigger question about Saylor’s never-sell stance, while easing Iran…
TL;DR Aave Labs has proposed onboarding Circle Wrapped Bitcoin, or cirBTC, to Aave V3 Core…
Bitcoin Magazine Standard Chartered Calls Crypto Bottom as Bitcoin Price Recovers From $59,000 Low Standard…
Senior market analyst Geoffrey Kendrick pointed to the SpaceX IPO and a potential U.S.-Iran peace…
Bitcoin ETF investors have pulled billions this year, but the broader crypto ETF market remains…
Bitcoin Magazine SpaceX Officially Joins Public Bitcoin Leaderboard as 8th Largest Holder With 18,712 BTC…