Bitcoin is struggling to recover above the $38,400 resistance zone against the US Dollar. BTC could resume decline if it stays below the $38,500 level.
Bitcoin is currently facing resistance near the $38,400 and $38,500 levels.
The price is trading below $38,500 and the 100 hourly simple moving average.
There is a crucial bearish trend line forming with resistance near $38,450 on the hourly chart of the BTC/USD pair (data feed from Kraken).
The pair could start a fresh decline if there is no clear move above $38,500.
Bitcoin Price Faces Hurdle
Bitcoin price found support near the $36,350 after a sharp decline. BTC formed a base and started a recovery wave above the $37,000 level. The price was able to surpass the $37,500 resistance level.
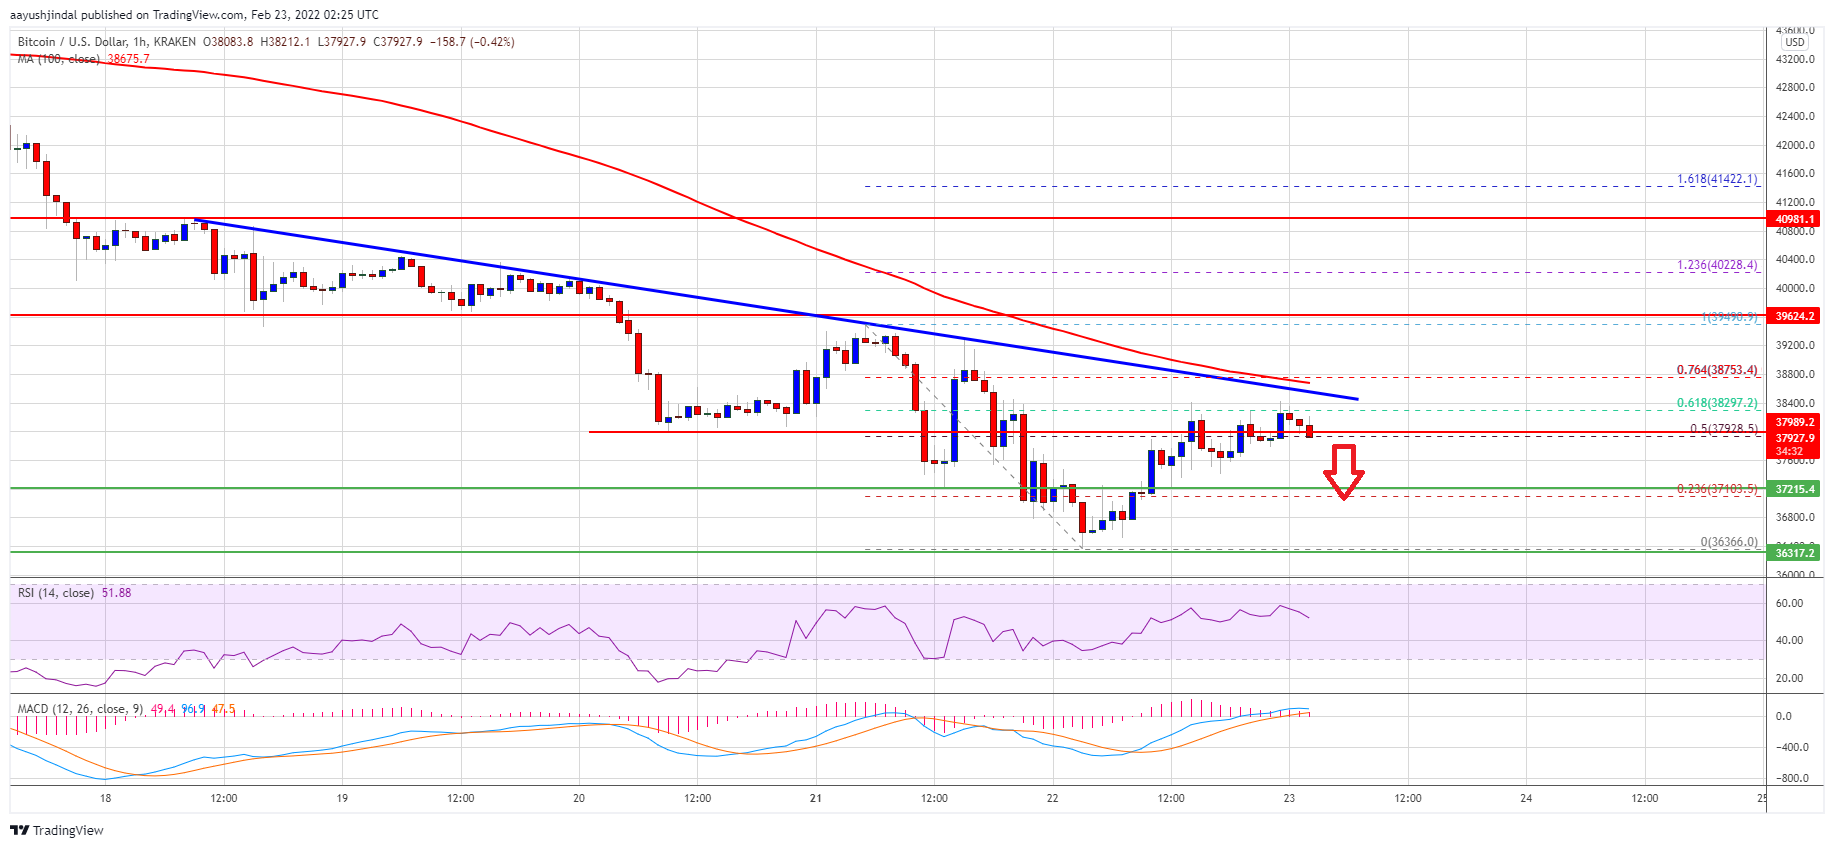
The bulls pushed the price above the 50% Fib retracement level of the key decline from the $39,492 swing high to $36,366 low. There was also a push above the $38,000 level. However, the price is now facing a strong resistance near the $38,250 level.
The 61.8% Fib retracement level of the key decline from the $39,492 swing high to $36,366 low is also near the $38,250 level. The next key resistance is near the $38,400 level.
There is also a crucial bearish trend line forming with resistance near $38,450 on the hourly chart of the BTC/USD pair. A clear move above the trend line resistance could send the price to $38,800 and the 100 hourly simple moving average.
Source: BTCUSD on TradingView.com
To gain bullish momentum, the price must settle above the $38,800 level. In the stated case, there are chances of a move above the $39,500 resistance.
Fresh Decline in BTC?
If bitcoin fails to start a recovery wave above the $38,400 resistance zone, it could start a fresh decline. An immediate support on the downside is near the $37,250 zone.
The next major support is seen near the $37,000 level. If there is a downside break below the $37,000 support zone, the price might gain bearish momentum for a move to $36,000. Any more losses could lead the price to $35,000.
Technical indicators:
Hourly MACD – The MACD is now losing pace in the bullish zone.
Hourly RSI (Relative Strength Index) – The RSI for BTC/USD is declining towards the 50 level.
Major Support Levels – $37,250, followed by $37,000.
Major Resistance Levels – $38,250, $38,400 and $39,500.
Bitcoin is struggling to recover above the $38,400 resistance zone against the US Dollar. BTC could resume decline if it stays below the $38,500 level.
Bitcoin is currently facing resistance near the $38,400 and $38,500 levels.
The price is trading below $38,500 and the 100 hourly simple moving average.
There is a crucial bearish trend line forming with resistance near $38,450 on the hourly chart of the BTC/USD pair (data feed from Kraken).
The pair could start a fresh decline if there is no clear move above $38,500.
Bitcoin price found support near the $36,350 after a sharp decline. BTC formed a base and started a recovery wave above the $37,000 level. The price was able to surpass the $37,500 resistance level.
The bulls pushed the price above the 50% Fib retracement level of the key decline from the $39,492 swing high to $36,366 low. There was also a push above the $38,000 level. However, the price is now facing a strong resistance near the $38,250 level.
The 61.8% Fib retracement level of the key decline from the $39,492 swing high to $36,366 low is also near the $38,250 level. The next key resistance is near the $38,400 level.
There is also a crucial bearish trend line forming with resistance near $38,450 on the hourly chart of the BTC/USD pair. A clear move above the trend line resistance could send the price to $38,800 and the 100 hourly simple moving average.
Source: BTCUSD on TradingView.com
To gain bullish momentum, the price must settle above the $38,800 level. In the stated case, there are chances of a move above the $39,500 resistance.
If bitcoin fails to start a recovery wave above the $38,400 resistance zone, it could start a fresh decline. An immediate support on the downside is near the $37,250 zone.
The next major support is seen near the $37,000 level. If there is a downside break below the $37,000 support zone, the price might gain bearish momentum for a move to $36,000. Any more losses could lead the price to $35,000.
Technical indicators:
Hourly MACD – The MACD is now losing pace in the bullish zone.
Hourly RSI (Relative Strength Index) – The RSI for BTC/USD is declining towards the 50 level.
Major Support Levels – $37,250, followed by $37,000.
Major Resistance Levels – $38,250, $38,400 and $39,500.
Tags: bitcoinbtcusdBTCUSDTxbtusd
FeedzyRead More
Leonidas' DOG Mode client challenges Bitcoin's default relay policies, reopening a philosophical debate over censorship,…
Large traders are betting on a BTC price rise to $72,000 by the end of…
The SEC has approved a NYSE Arca rule change that raises position and exercise limits…
Polymarket traders are pricing in a high probability that the Federal Reserve holds rates steady…
Bitcoin Magazine Bitcoin Sentiment Is Turning Bullish — But It’s Too Early to Celebrate: Report…
Bitcoin slipped below $63,000 as the wider risk trade came under pressure, with weakness in…