Bitcoin is struggling to recover above the $38,400 resistance zone against the US Dollar. BTC could resume decline if it stays below the $38,500 level.
Bitcoin is currently facing resistance near the $38,400 and $38,500 levels.
The price is trading below $38,500 and the 100 hourly simple moving average.
There is a crucial bearish trend line forming with resistance near $38,450 on the hourly chart of the BTC/USD pair (data feed from Kraken).
The pair could start a fresh decline if there is no clear move above $38,500.
Bitcoin Price Faces Hurdle
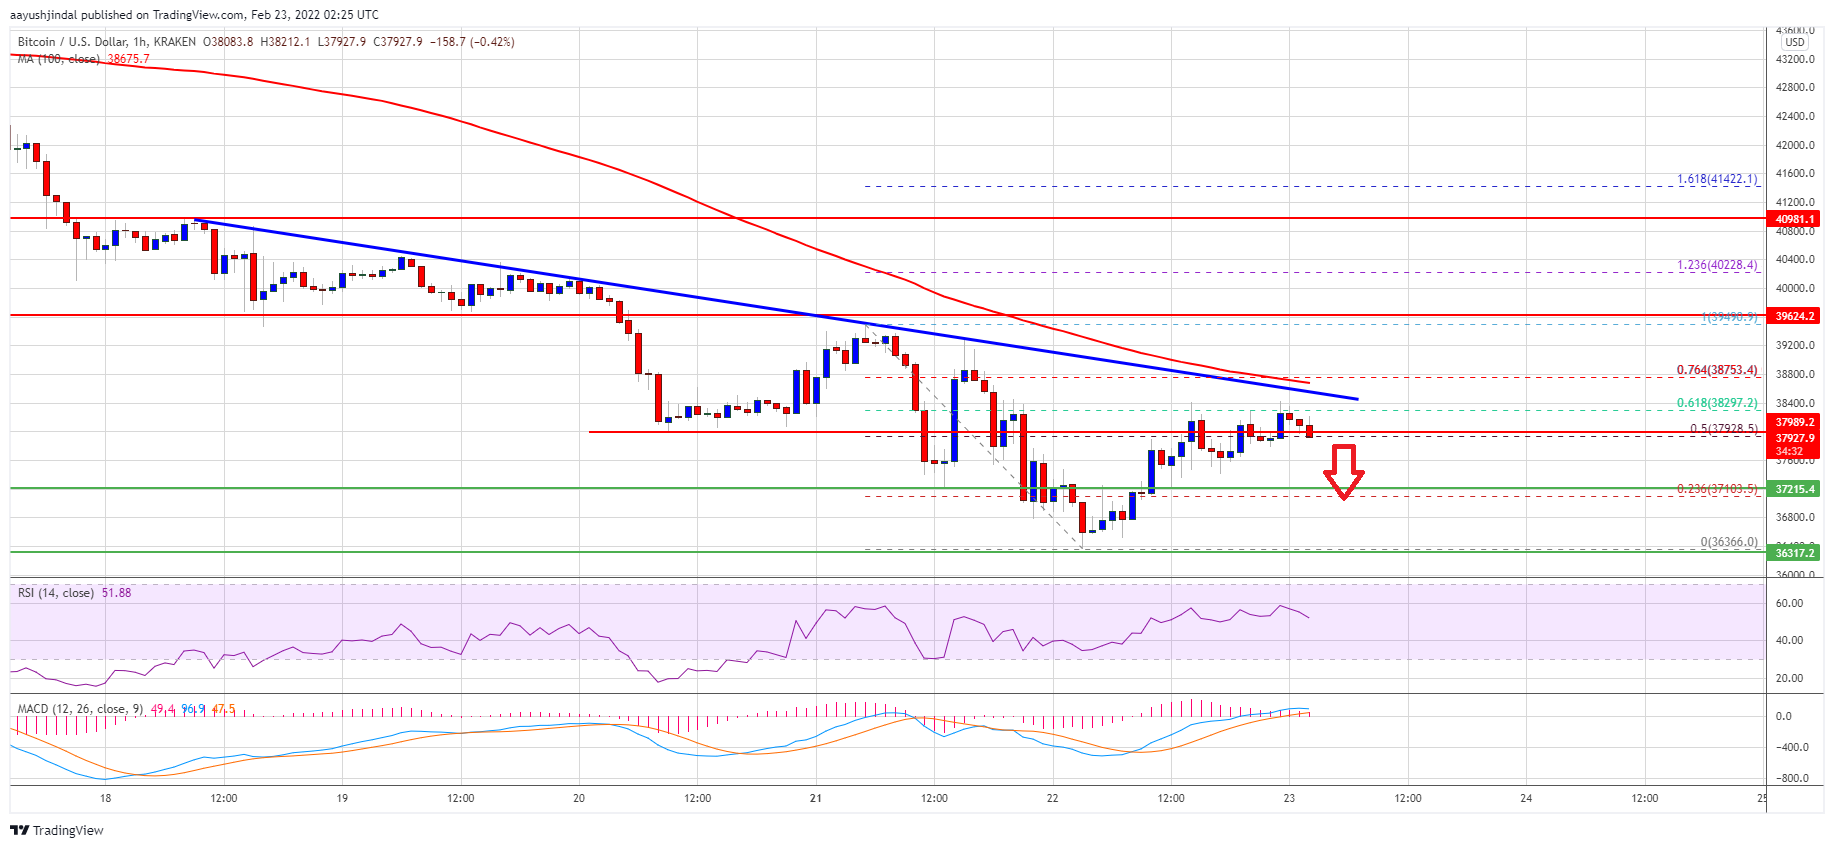
Bitcoin price found support near the $36,350 after a sharp decline. BTC formed a base and started a recovery wave above the $37,000 level. The price was able to surpass the $37,500 resistance level.
The bulls pushed the price above the 50% Fib retracement level of the key decline from the $39,492 swing high to $36,366 low. There was also a push above the $38,000 level. However, the price is now facing a strong resistance near the $38,250 level.
The 61.8% Fib retracement level of the key decline from the $39,492 swing high to $36,366 low is also near the $38,250 level. The next key resistance is near the $38,400 level.
There is also a crucial bearish trend line forming with resistance near $38,450 on the hourly chart of the BTC/USD pair. A clear move above the trend line resistance could send the price to $38,800 and the 100 hourly simple moving average.
Source: BTCUSD on TradingView.com
To gain bullish momentum, the price must settle above the $38,800 level. In the stated case, there are chances of a move above the $39,500 resistance.
Fresh Decline in BTC?
If bitcoin fails to start a recovery wave above the $38,400 resistance zone, it could start a fresh decline. An immediate support on the downside is near the $37,250 zone.
The next major support is seen near the $37,000 level. If there is a downside break below the $37,000 support zone, the price might gain bearish momentum for a move to $36,000. Any more losses could lead the price to $35,000.
Technical indicators:
Hourly MACD – The MACD is now losing pace in the bullish zone.
Hourly RSI (Relative Strength Index) – The RSI for BTC/USD is declining towards the 50 level.
Major Support Levels – $37,250, followed by $37,000.
Major Resistance Levels – $38,250, $38,400 and $39,500.
Bitcoin is struggling to recover above the $38,400 resistance zone against the US Dollar. BTC could resume decline if it stays below the $38,500 level.
Bitcoin is currently facing resistance near the $38,400 and $38,500 levels.
The price is trading below $38,500 and the 100 hourly simple moving average.
There is a crucial bearish trend line forming with resistance near $38,450 on the hourly chart of the BTC/USD pair (data feed from Kraken).
The pair could start a fresh decline if there is no clear move above $38,500.
Bitcoin price found support near the $36,350 after a sharp decline. BTC formed a base and started a recovery wave above the $37,000 level. The price was able to surpass the $37,500 resistance level.
The bulls pushed the price above the 50% Fib retracement level of the key decline from the $39,492 swing high to $36,366 low. There was also a push above the $38,000 level. However, the price is now facing a strong resistance near the $38,250 level.
The 61.8% Fib retracement level of the key decline from the $39,492 swing high to $36,366 low is also near the $38,250 level. The next key resistance is near the $38,400 level.
There is also a crucial bearish trend line forming with resistance near $38,450 on the hourly chart of the BTC/USD pair. A clear move above the trend line resistance could send the price to $38,800 and the 100 hourly simple moving average.
Source: BTCUSD on TradingView.com
To gain bullish momentum, the price must settle above the $38,800 level. In the stated case, there are chances of a move above the $39,500 resistance.
If bitcoin fails to start a recovery wave above the $38,400 resistance zone, it could start a fresh decline. An immediate support on the downside is near the $37,250 zone.
The next major support is seen near the $37,000 level. If there is a downside break below the $37,000 support zone, the price might gain bearish momentum for a move to $36,000. Any more losses could lead the price to $35,000.
Technical indicators:
Hourly MACD – The MACD is now losing pace in the bullish zone.
Hourly RSI (Relative Strength Index) – The RSI for BTC/USD is declining towards the 50 level.
Major Support Levels – $37,250, followed by $37,000.
Major Resistance Levels – $38,250, $38,400 and $39,500.
Tags: bitcoinbtcusdBTCUSDTxbtusd
FeedzyRead More
Strategy’s stock is trading below the value of its own Bitcoin holdings — an unusual…
The cryptocurrency community pushed back, with Michael Saylor saying Bitcoin has no issuer, promoter, or…
Crypto pundit Crypto Bully has shared his base case for Bitcoin and what to expect…
The past week recorded a significant change in the Bitcoin price action, where there was…
The largest publicly traded corporate holder of bitcoin would need to buy roughly 6,158 BTC…
On-chain analytics firm Glassnode has highlighted how Bitcoin has only seen a relatively thin accumulation…