Bitcoin extended losses below the $23,650 support zone against the US Dollar. BTC must stay above $23,200 to avoid more losses in the near term.
Bitcoin remained in a bearish zone and traded below the $23,650 support.
The price is now trading below the $23,650 level and the 100 hourly simple moving average.
There is a connecting bearish trend line forming with resistance near $24,000 on the hourly chart of the BTC/USD pair (data feed from Kraken).
The pair could extend losses if there is a clear move below the $23,200 support in the near term.
Bitcoin Price Drops Further
Bitcoin price failed to stay in a positive zone above the $24,000 level. BTC started another decline and traded below the $23,650 support zone.
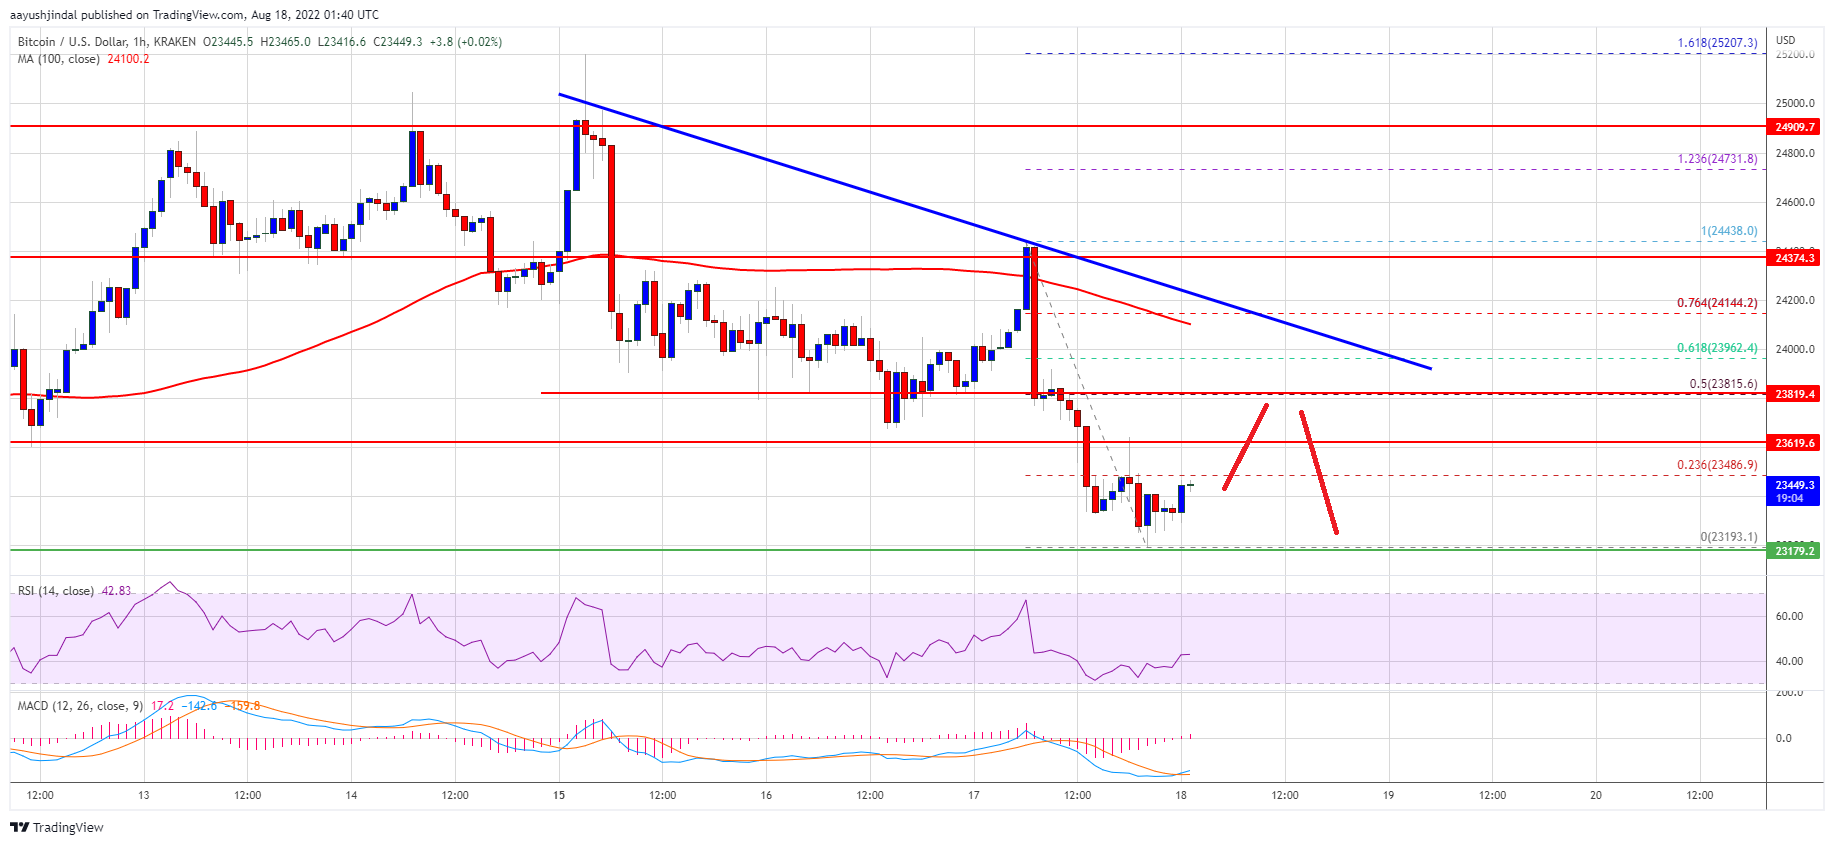
There was a clear move below the $23,500 level and the 100 hourly simple moving average. Finally, the price found support near the $23,200 zone. A low was formed near $23,193 and the price is now consolidating losses.
Bitcoin price is now trading below the $23,650 level and the 100 hourly simple moving average. On the upside, an immediate resistance is near the $23,500 level. It is near the 23.6% Fib retracement level of the recent decline from the $24,438 swing high to $23,193 low.
The first major resistance on the upside sits near the $23,800 level. It is near the 50% Fib retracement level of the recent decline from the $24,438 swing high to $23,193 low.
The main resistance is forming near the $24,000 zone and the 100 hourly simple moving average. There is also a connecting bearish trend line forming with resistance near $24,000 on the hourly chart of the BTC/USD pair. A close above the $23,800 and $24,000 resistance levels might start another increase.
Source: BTCUSD on TradingView.com
In the stated case, the price may perhaps climb towards the $24,500 resistance. Any more gains might send the price towards the $25,000 level.
More Losses in BTC?
If bitcoin fails to clear the $24,000 resistance zone, it could continue to move down. An immediate support on the downside is near the $23,320 level.
The next major support now sits near the $23,200 level. A downside break and close below the $23,200 level might spark another decline. In the stated case, the price might decline towards the $22,750 level.
Technical indicators:
Hourly MACD – The MACD is now losing pace in the bearish zone.
Hourly RSI (Relative Strength Index) – The RSI for BTC/USD is now below the 50 level.
Major Support Levels – $23,320, followed by $23,200.
Major Resistance Levels – $23,500, $23,800 and $24,000.
Bitcoin extended losses below the $23,650 support zone against the US Dollar. BTC must stay above $23,200 to avoid more losses in the near term.
Bitcoin remained in a bearish zone and traded below the $23,650 support.
The price is now trading below the $23,650 level and the 100 hourly simple moving average.
There is a connecting bearish trend line forming with resistance near $24,000 on the hourly chart of the BTC/USD pair (data feed from Kraken).
The pair could extend losses if there is a clear move below the $23,200 support in the near term.
Bitcoin price failed to stay in a positive zone above the $24,000 level. BTC started another decline and traded below the $23,650 support zone.
There was a clear move below the $23,500 level and the 100 hourly simple moving average. Finally, the price found support near the $23,200 zone. A low was formed near $23,193 and the price is now consolidating losses.
Bitcoin price is now trading below the $23,650 level and the 100 hourly simple moving average. On the upside, an immediate resistance is near the $23,500 level. It is near the 23.6% Fib retracement level of the recent decline from the $24,438 swing high to $23,193 low.
The first major resistance on the upside sits near the $23,800 level. It is near the 50% Fib retracement level of the recent decline from the $24,438 swing high to $23,193 low.
The main resistance is forming near the $24,000 zone and the 100 hourly simple moving average. There is also a connecting bearish trend line forming with resistance near $24,000 on the hourly chart of the BTC/USD pair. A close above the $23,800 and $24,000 resistance levels might start another increase.
Source: BTCUSD on TradingView.com
In the stated case, the price may perhaps climb towards the $24,500 resistance. Any more gains might send the price towards the $25,000 level.
If bitcoin fails to clear the $24,000 resistance zone, it could continue to move down. An immediate support on the downside is near the $23,320 level.
The next major support now sits near the $23,200 level. A downside break and close below the $23,200 level might spark another decline. In the stated case, the price might decline towards the $22,750 level.
Technical indicators:
Hourly MACD – The MACD is now losing pace in the bearish zone.
Hourly RSI (Relative Strength Index) – The RSI for BTC/USD is now below the 50 level.
Major Support Levels – $23,320, followed by $23,200.
Major Resistance Levels – $23,500, $23,800 and $24,000.
Tags: bitcoinbtcusdBTCUSDTxbtusd
NewsBTCRead More
As Bitcoin (BTC) recovers from its recent drop below the $75,000 support, some market observers…
Bitcoin’s recent drop below key support may have been more than just a bearish breakdown.…
Enflux says “the bid is there” but no one is adding size, while Glassnode data…
A closely watched on-chain indicator has returned to a range that has marked major turning…
Bitcoin price started a downside correction from the $78,000 zone. BTC is consolidating and might…
On-chain data shows a net amount of Bitcoin has been flowing into Binance for 10…