Bitcoin started a fresh decline below the $22,000 support against the US Dollar. BTC is declining and might extend losses below the $20,500 support zone.
Bitcoin started a fresh decline and traded below the $22,000 level.
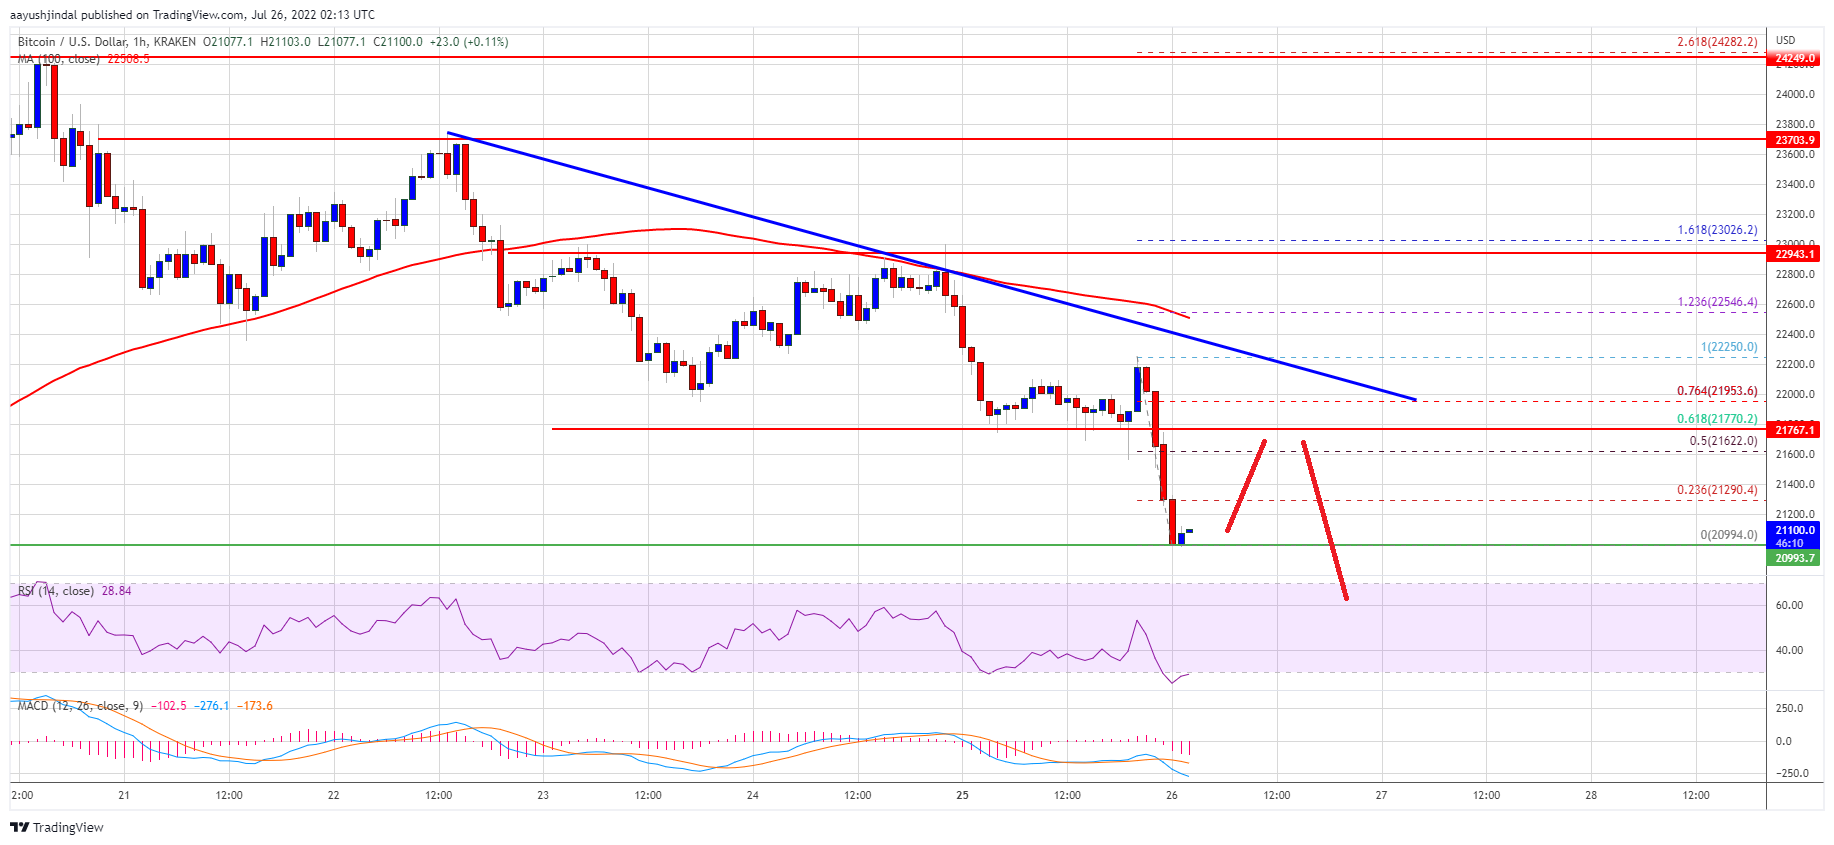
The price is now trading below the $22,000 level and the 100 hourly simple moving average.
There is a major bearish trend line forming with resistance near $21,950 on the hourly chart of the BTC/USD pair (data feed from Kraken).
The pair might decline further if there is a clear move below the $20,800 level.
Bitcoin Price Gains Bearish Momentum
Bitcoin price started a fresh decline after it failed to clear the $24,000 resistance zone. There was a steady decline below the $23,500 and $23,000 levels.
The bears gained strength for a move below the $22,500 support level and the 100 hourly simple moving average. Finally, the price traded below the $21,500 support level and even spiked below $21,000. A low is formed near $20,994 and the price is now consolidating losses.
On the upside, bitcoin price could face resistance near the $21,650 level. It is near the 50% Fib retracement level of the recent decline from the $22,250 swing high to $20,994 low.
The next key resistance is near the $22,000 zone. There is also a major bearish trend line forming with resistance near $21,950 on the hourly chart of the BTC/USD pair. The trend line is near the 76.4% Fib retracement level of the recent decline from the $22,250 swing high to $20,994 low.
Source: BTCUSD on TradingView.com
A close above the $22,000 resistance zone could set the pace for more gains. In the stated case, the price may perhaps rise towards the $22,500 level. The next major resistance sits near the $23,000 level.
More Losses in BTC?
If bitcoin fails to start a recovery wave above the $21,650 level, it could continue to move down. An immediate support on the downside is near the $21,000 level.
The next major support now sits near the $20,500 level. A clear break and close below the $20,500 support zone might send the price towards $20,000 in the near term.
Technical indicators:
Hourly MACD – The MACD is now gaining pace in the bearish zone.
Hourly RSI (Relative Strength Index) – The RSI for BTC/USD is well below the 50 level.
Major Support Levels – $21,000, followed by $20,500.
Major Resistance Levels – $21,650, $22,000 and $22,500.
Bitcoin started a fresh decline below the $22,000 support against the US Dollar. BTC is declining and might extend losses below the $20,500 support zone.
Bitcoin started a fresh decline and traded below the $22,000 level.
The price is now trading below the $22,000 level and the 100 hourly simple moving average.
There is a major bearish trend line forming with resistance near $21,950 on the hourly chart of the BTC/USD pair (data feed from Kraken).
The pair might decline further if there is a clear move below the $20,800 level.
Bitcoin price started a fresh decline after it failed to clear the $24,000 resistance zone. There was a steady decline below the $23,500 and $23,000 levels.
The bears gained strength for a move below the $22,500 support level and the 100 hourly simple moving average. Finally, the price traded below the $21,500 support level and even spiked below $21,000. A low is formed near $20,994 and the price is now consolidating losses.
On the upside, bitcoin price could face resistance near the $21,650 level. It is near the 50% Fib retracement level of the recent decline from the $22,250 swing high to $20,994 low.
The next key resistance is near the $22,000 zone. There is also a major bearish trend line forming with resistance near $21,950 on the hourly chart of the BTC/USD pair. The trend line is near the 76.4% Fib retracement level of the recent decline from the $22,250 swing high to $20,994 low.
Source: BTCUSD on TradingView.com
A close above the $22,000 resistance zone could set the pace for more gains. In the stated case, the price may perhaps rise towards the $22,500 level. The next major resistance sits near the $23,000 level.
If bitcoin fails to start a recovery wave above the $21,650 level, it could continue to move down. An immediate support on the downside is near the $21,000 level.
The next major support now sits near the $20,500 level. A clear break and close below the $20,500 support zone might send the price towards $20,000 in the near term.
Technical indicators:
Hourly MACD – The MACD is now gaining pace in the bearish zone.
Hourly RSI (Relative Strength Index) – The RSI for BTC/USD is well below the 50 level.
Major Support Levels – $21,000, followed by $20,500.
Major Resistance Levels – $21,650, $22,000 and $22,500.
Tags: bitcoinbtcusdBTCUSDTxbtusd
FeedzyRead More
BlackRock's IBIT shed another $342 million on Wednesday as ether, solana and XRP funds joined…
Bitcoin has lost the $66,000 level as selling pressure and uncertainty intensify across a market…
XRP price extended losses and traded below $1.20. The price is now consolidating losses and…
Bitcoin’s futures market is flashing a warning that analysts say could mean more pain ahead.…
Analysts and market observers are saying bitcoin's crash is happening due to traders chasing momentum…
Presto Research says bitcoin's drawdowns this year have coincided with rallies in AI stocks and…