Bitcoin started a fresh decline below the $22,000 support against the US Dollar. BTC is declining and might extend losses below the $20,500 support zone.
Bitcoin started a fresh decline and traded below the $22,000 level.
The price is now trading below the $22,000 level and the 100 hourly simple moving average.
There is a major bearish trend line forming with resistance near $21,950 on the hourly chart of the BTC/USD pair (data feed from Kraken).
The pair might decline further if there is a clear move below the $20,800 level.
Bitcoin Price Gains Bearish Momentum
Bitcoin price started a fresh decline after it failed to clear the $24,000 resistance zone. There was a steady decline below the $23,500 and $23,000 levels.
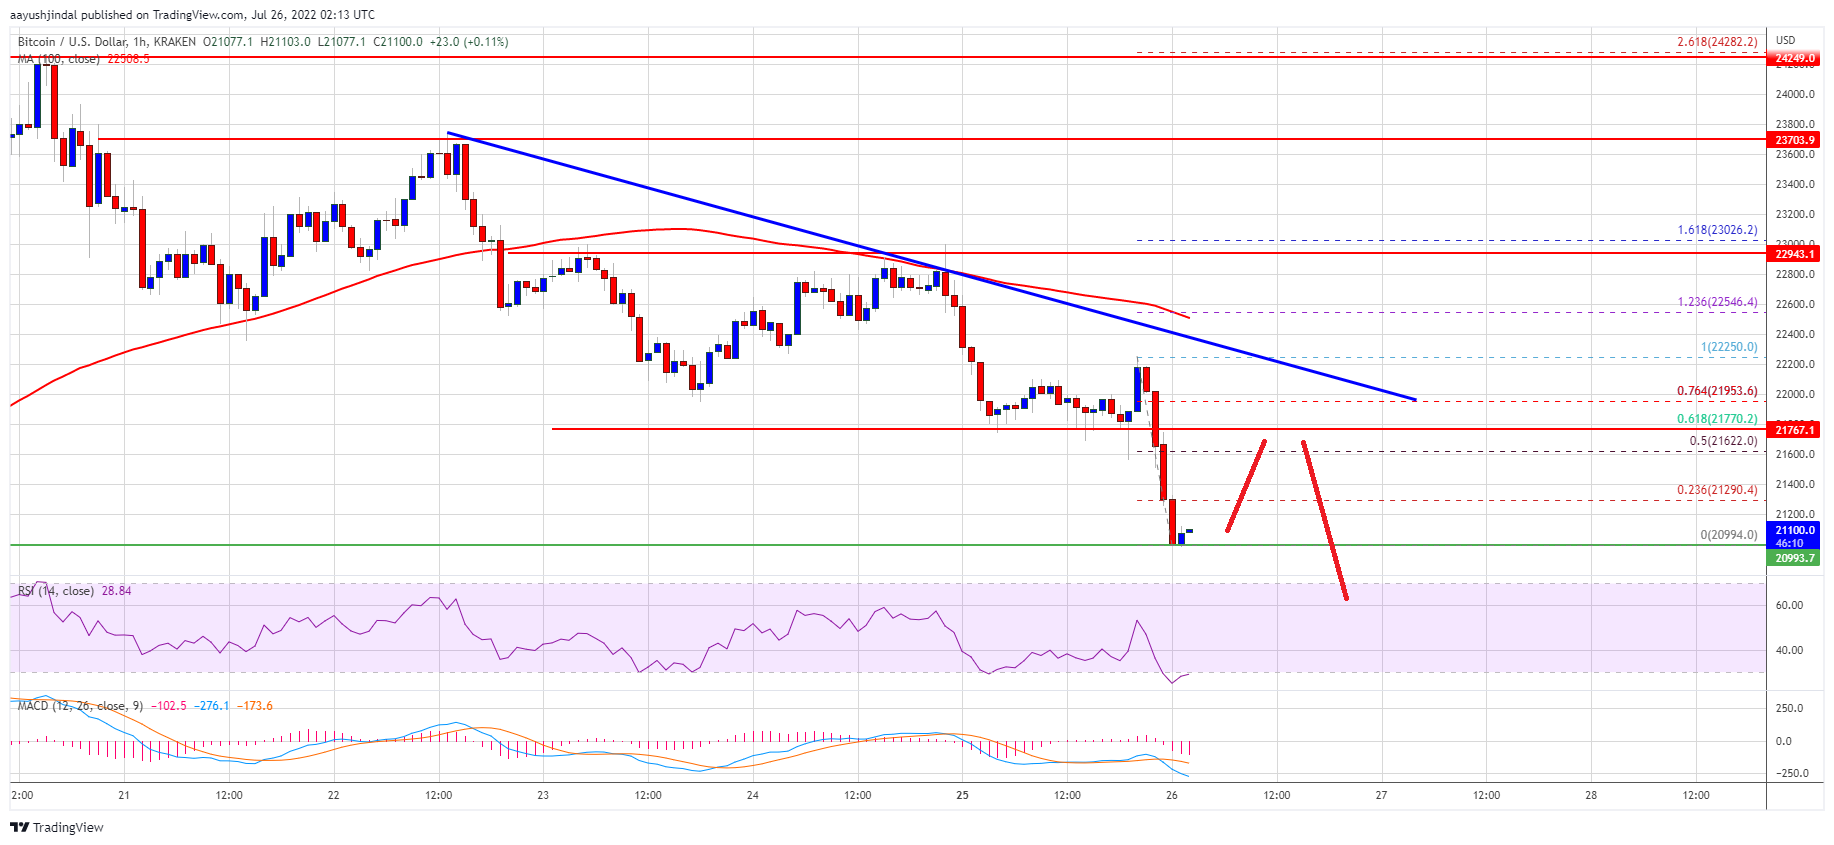
The bears gained strength for a move below the $22,500 support level and the 100 hourly simple moving average. Finally, the price traded below the $21,500 support level and even spiked below $21,000. A low is formed near $20,994 and the price is now consolidating losses.
On the upside, bitcoin price could face resistance near the $21,650 level. It is near the 50% Fib retracement level of the recent decline from the $22,250 swing high to $20,994 low.
The next key resistance is near the $22,000 zone. There is also a major bearish trend line forming with resistance near $21,950 on the hourly chart of the BTC/USD pair. The trend line is near the 76.4% Fib retracement level of the recent decline from the $22,250 swing high to $20,994 low.
Source: BTCUSD on TradingView.com
A close above the $22,000 resistance zone could set the pace for more gains. In the stated case, the price may perhaps rise towards the $22,500 level. The next major resistance sits near the $23,000 level.
More Losses in BTC?
If bitcoin fails to start a recovery wave above the $21,650 level, it could continue to move down. An immediate support on the downside is near the $21,000 level.
The next major support now sits near the $20,500 level. A clear break and close below the $20,500 support zone might send the price towards $20,000 in the near term.
Technical indicators:
Hourly MACD – The MACD is now gaining pace in the bearish zone.
Hourly RSI (Relative Strength Index) – The RSI for BTC/USD is well below the 50 level.
Major Support Levels – $21,000, followed by $20,500.
Major Resistance Levels – $21,650, $22,000 and $22,500.
Bitcoin started a fresh decline below the $22,000 support against the US Dollar. BTC is declining and might extend losses below the $20,500 support zone.
Bitcoin started a fresh decline and traded below the $22,000 level.
The price is now trading below the $22,000 level and the 100 hourly simple moving average.
There is a major bearish trend line forming with resistance near $21,950 on the hourly chart of the BTC/USD pair (data feed from Kraken).
The pair might decline further if there is a clear move below the $20,800 level.
Bitcoin price started a fresh decline after it failed to clear the $24,000 resistance zone. There was a steady decline below the $23,500 and $23,000 levels.
The bears gained strength for a move below the $22,500 support level and the 100 hourly simple moving average. Finally, the price traded below the $21,500 support level and even spiked below $21,000. A low is formed near $20,994 and the price is now consolidating losses.
On the upside, bitcoin price could face resistance near the $21,650 level. It is near the 50% Fib retracement level of the recent decline from the $22,250 swing high to $20,994 low.
The next key resistance is near the $22,000 zone. There is also a major bearish trend line forming with resistance near $21,950 on the hourly chart of the BTC/USD pair. The trend line is near the 76.4% Fib retracement level of the recent decline from the $22,250 swing high to $20,994 low.
Source: BTCUSD on TradingView.com
A close above the $22,000 resistance zone could set the pace for more gains. In the stated case, the price may perhaps rise towards the $22,500 level. The next major resistance sits near the $23,000 level.
If bitcoin fails to start a recovery wave above the $21,650 level, it could continue to move down. An immediate support on the downside is near the $21,000 level.
The next major support now sits near the $20,500 level. A clear break and close below the $20,500 support zone might send the price towards $20,000 in the near term.
Technical indicators:
Hourly MACD – The MACD is now gaining pace in the bearish zone.
Hourly RSI (Relative Strength Index) – The RSI for BTC/USD is well below the 50 level.
Major Support Levels – $21,000, followed by $20,500.
Major Resistance Levels – $21,650, $22,000 and $22,500.
Tags: bitcoinbtcusdBTCUSDTxbtusd
FeedzyRead More
Hougan says bitcoin could reach that milestone if it captures a larger share of the…
After another failed attempt at breaking the $74,000 resistance, the Bitcoin price continues to hover…
Prominent analyst Darkfost shares that Bitcoin remains a long time away from establishing a new…
Over the last day, Bitcoin prices have remained within the $70,000 – $72,000 region, recording…
Each escalation in the Iran conflict has been larger than the last, but each bitcoin…
The Bitcoin price has not particularly impressed over the past two weeks, but it appears…