Bitcoin is showing bearish signs below the $20,000 support zone against the US Dollar. BTC could accelerate further lower below the $19,500 support zone.
Bitcoin started a fresh decline and traded below the $20,000 support.
The price is now trading below $20,200 and the 100 hourly simple moving average.
There is a major bearish trend line forming with resistance near $20,050 on the hourly chart of the BTC/USD pair (data feed from Kraken).
The pair could start a substantial decline if it breaks the $19,500 support zone.
Bitcoin Price Remains At Risk
Bitcoin price attempted a recovery wave above the $20,300 resistance level. However, there was no upside break and the price remained in a bearish zone below $20,500.
Recently, Ethereum saw a major bearish reaction below the $1,500 support. As a result, BTC also moved a few points lower and declined below the $20,000 support. It even traded below the $19,600 and tested the $19,500 support zone.
A low is formed near $19,509 and the price is now consolidating losses. Bitcoin price is now trading below $20,200 and the 100 hourly simple moving average.
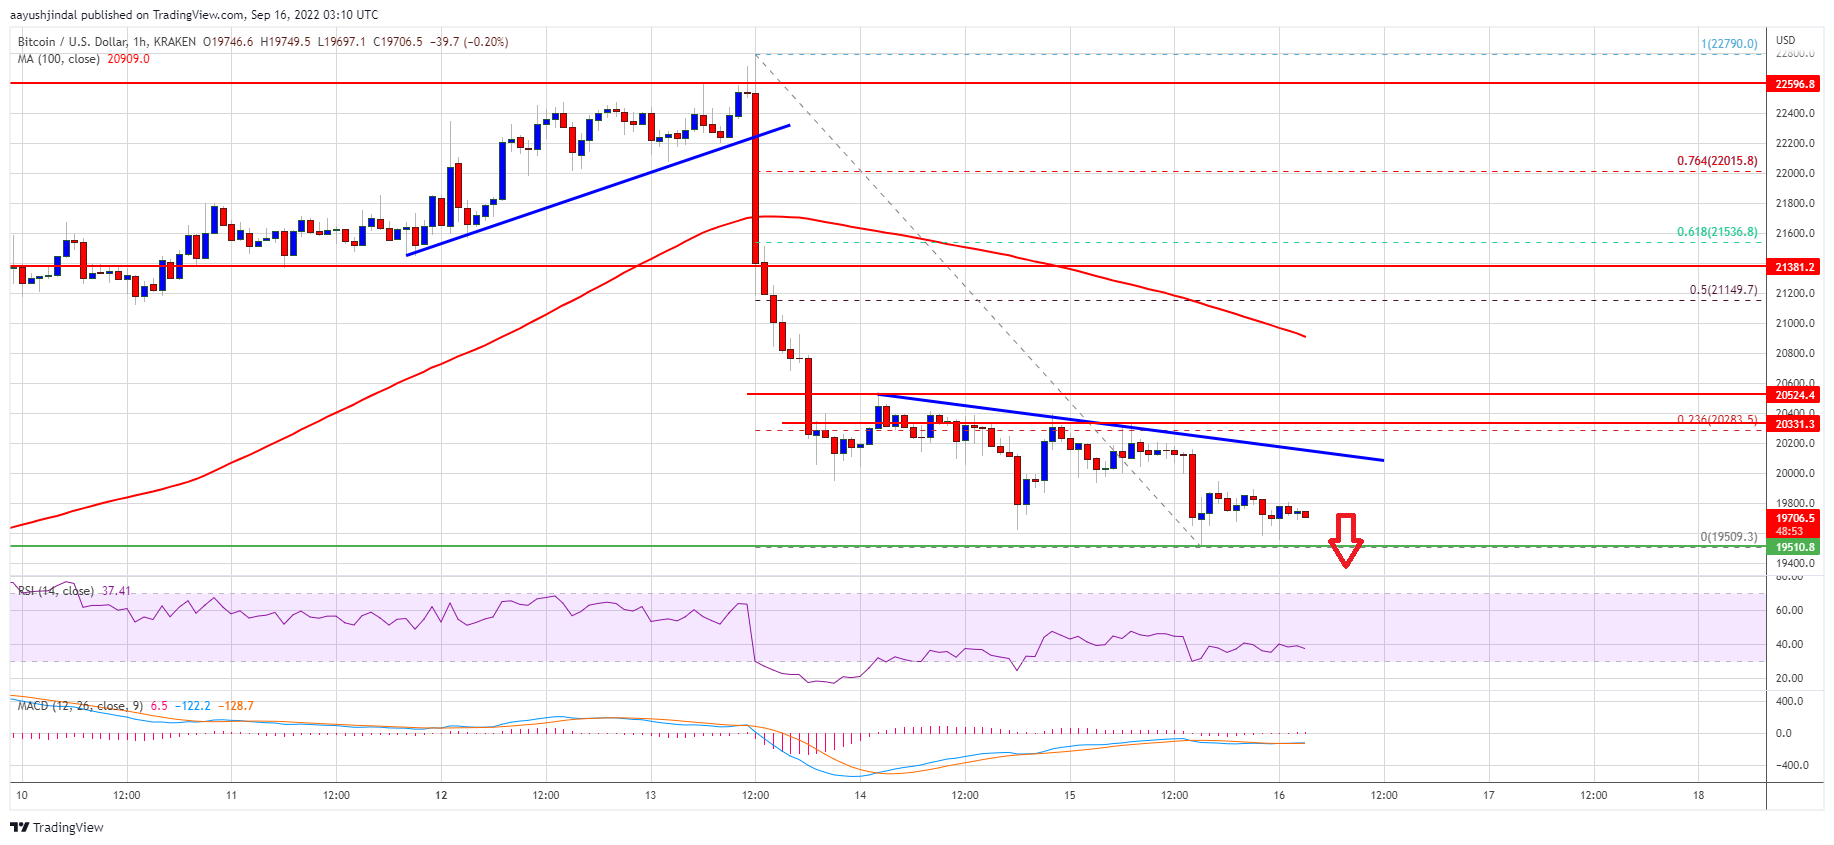
On the upside, an immediate resistance is near the $20,000 level. There is also a major bearish trend line forming with resistance near $20,050 on the hourly chart of the BTC/USD pair. Besides, the 23.6% Fib retracement level of the main decline from the $22,790 swing high to $19,509 low is just above the trend line.
The next major resistance sits near the $21,000 level and the 100 hourly simple moving average. It coincides with the 50% Fib retracement level of the main decline from the $22,790 swing high to $19,509 low.
Source: BTCUSD on TradingView.com
A close above the $21,000 resistance might start a fresh increase. In the stated case, the price may perhaps rise towards $21,400. Any more gains might send the price towards the $22,000 resistance zone.
More Losses in BTC?
If bitcoin fails to start a recovery wave above the $20,000 resistance zone, it could continue to move down. An immediate support on the downside is near the $19,500 zone.
The next major support is near the $19,200 levels. A clear move below the $19,500 and $19,200 levels might open the doors for a move towards the $18,500 level.
Technical indicators:
Hourly MACD – The MACD is now gaining pace in the bearish zone.
Hourly RSI (Relative Strength Index) – The RSI for BTC/USD is now below the 50 level.
Major Support Levels – $19,500, followed by $19,200.
Major Resistance Levels – $20,000, $20,050 and $20,300.
Bitcoin is showing bearish signs below the $20,000 support zone against the US Dollar. BTC could accelerate further lower below the $19,500 support zone.
Bitcoin started a fresh decline and traded below the $20,000 support.
The price is now trading below $20,200 and the 100 hourly simple moving average.
There is a major bearish trend line forming with resistance near $20,050 on the hourly chart of the BTC/USD pair (data feed from Kraken).
The pair could start a substantial decline if it breaks the $19,500 support zone.
Bitcoin price attempted a recovery wave above the $20,300 resistance level. However, there was no upside break and the price remained in a bearish zone below $20,500.
Recently, Ethereum saw a major bearish reaction below the $1,500 support. As a result, BTC also moved a few points lower and declined below the $20,000 support. It even traded below the $19,600 and tested the $19,500 support zone.
A low is formed near $19,509 and the price is now consolidating losses. Bitcoin price is now trading below $20,200 and the 100 hourly simple moving average.
On the upside, an immediate resistance is near the $20,000 level. There is also a major bearish trend line forming with resistance near $20,050 on the hourly chart of the BTC/USD pair. Besides, the 23.6% Fib retracement level of the main decline from the $22,790 swing high to $19,509 low is just above the trend line.
The next major resistance sits near the $21,000 level and the 100 hourly simple moving average. It coincides with the 50% Fib retracement level of the main decline from the $22,790 swing high to $19,509 low.
Source: BTCUSD on TradingView.com
A close above the $21,000 resistance might start a fresh increase. In the stated case, the price may perhaps rise towards $21,400. Any more gains might send the price towards the $22,000 resistance zone.
If bitcoin fails to start a recovery wave above the $20,000 resistance zone, it could continue to move down. An immediate support on the downside is near the $19,500 zone.
The next major support is near the $19,200 levels. A clear move below the $19,500 and $19,200 levels might open the doors for a move towards the $18,500 level.
Technical indicators:
Hourly MACD – The MACD is now gaining pace in the bearish zone.
Hourly RSI (Relative Strength Index) – The RSI for BTC/USD is now below the 50 level.
Major Support Levels – $19,500, followed by $19,200.
Major Resistance Levels – $20,000, $20,050 and $20,300.
Tags: bitcoinbtcusdBTCUSDTxbtusd
NewsBTCRead More
Each escalation in the Iran conflict has been larger than the last, but each bitcoin…
The Bitcoin price has not particularly impressed over the past two weeks, but it appears…
Bitcoin’s extended pullback from its all-time high has left traders in uncertainty, and many investors…
Bitcoin recently pushed into a key liquidity pocket near the $73,000 level, briefly tapping overhead…
The price of Bitcoin put in another interesting performance over the past week, as the…
Strategy’s stock is trading below the value of its own Bitcoin holdings — an unusual…