Bitcoin started a sharp downside correction below the $22,000 level against the US Dollar. BTC must stay above the $20,000 support to avoid more losses.
Bitcoin failed to clear $22,750 and started a sharp downward move.
The price is now trading below $21,000 and the 100 hourly simple moving average.
There was a break below a key bullish trend line with support near $21,810 on the hourly chart of the BTC/USD pair (data feed from Kraken).
The pair is consolidating above the $20,000 level, with a minor bullish angle.
Bitcoin Price Dives To $20K
Bitcoin price attempted to gain strength above the $22,000 and $22,500 resistance levels. The price even spiked above the $22,750 resistance zone and the 100 hourly simple moving average.
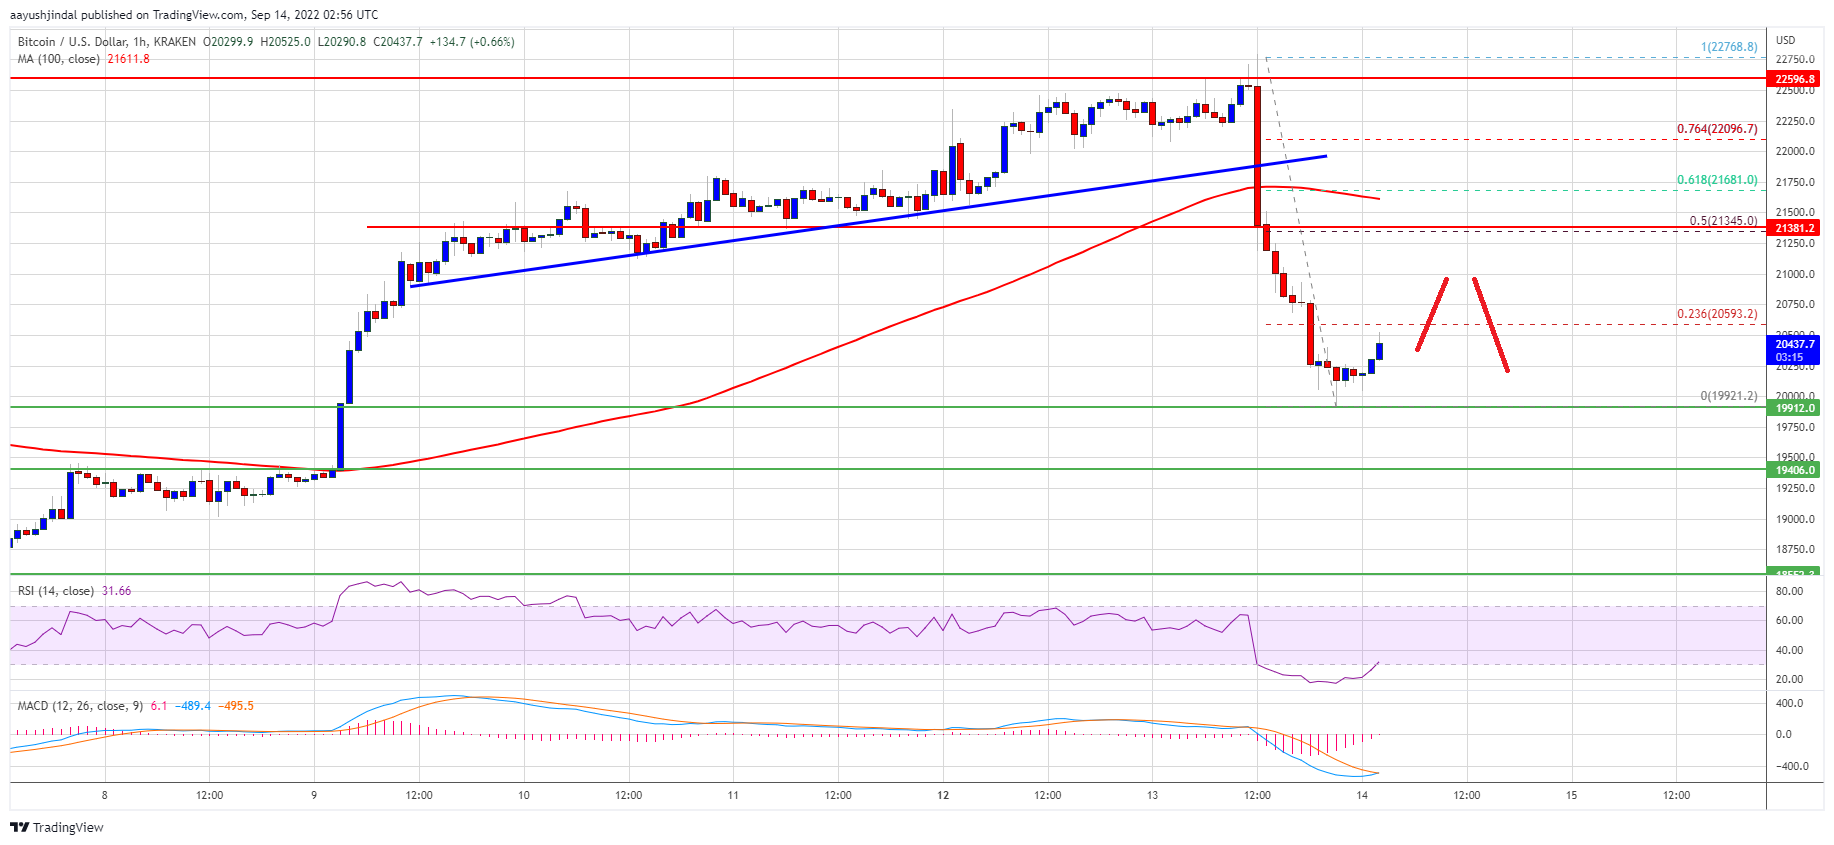
However, the price failed to gain strength and topped near the $22,768 level. As a result, there was a bearish wave below the $22,000 and $21,500 levels. There was also a move below the $21,000 level and the 100 hourly simple moving average.
Besides, there was a break below a key bullish trend line with support near $21,810 on the hourly chart of the BTC/USD pair. Bitcoin price even tested the $20,000 zone. A low is formed near $19,921 and the price is now consolidating losses.
On the upside, an immediate resistance is near the $20,600 level. It is near the 23.6% Fib retracement level of the recent decline from the $22,768 swing high to $19,921 low.
Source: BTCUSD on TradingView.com
The next major resistance sits near the $21,350 level. It coincides with the 50% Fib retracement level of the recent decline from the $22,768 swing high to $19,921 low. A close above the $21,350 resistance might start a fresh surge. In the stated case, the price may perhaps rise towards $22,000. Any more gains might send the price towards the $22,500 resistance zone.
More Losses in BTC?
If bitcoin fails to clear the $21,350 resistance zone, it could continue to move down. An immediate support on the downside is near the $22,000 zone.
The next major support is near the $19,500 and $19,400 levels. A downside break below the $19,400 level might send the price towards the $18,500 support.
Technical indicators:
Hourly MACD – The MACD is now losing pace in the bearish zone.
Hourly RSI (Relative Strength Index) – The RSI for BTC/USD is now recovering from the oversold levels.
Major Support Levels – $20,000, followed by $19,400.
Major Resistance Levels – $20,600, $21,000 and $21,350.
Bitcoin started a sharp downside correction below the $22,000 level against the US Dollar. BTC must stay above the $20,000 support to avoid more losses.
Bitcoin failed to clear $22,750 and started a sharp downward move.
The price is now trading below $21,000 and the 100 hourly simple moving average.
There was a break below a key bullish trend line with support near $21,810 on the hourly chart of the BTC/USD pair (data feed from Kraken).
The pair is consolidating above the $20,000 level, with a minor bullish angle.
Bitcoin price attempted to gain strength above the $22,000 and $22,500 resistance levels. The price even spiked above the $22,750 resistance zone and the 100 hourly simple moving average.
However, the price failed to gain strength and topped near the $22,768 level. As a result, there was a bearish wave below the $22,000 and $21,500 levels. There was also a move below the $21,000 level and the 100 hourly simple moving average.
Besides, there was a break below a key bullish trend line with support near $21,810 on the hourly chart of the BTC/USD pair. Bitcoin price even tested the $20,000 zone. A low is formed near $19,921 and the price is now consolidating losses.
On the upside, an immediate resistance is near the $20,600 level. It is near the 23.6% Fib retracement level of the recent decline from the $22,768 swing high to $19,921 low.
Source: BTCUSD on TradingView.com
The next major resistance sits near the $21,350 level. It coincides with the 50% Fib retracement level of the recent decline from the $22,768 swing high to $19,921 low. A close above the $21,350 resistance might start a fresh surge. In the stated case, the price may perhaps rise towards $22,000. Any more gains might send the price towards the $22,500 resistance zone.
If bitcoin fails to clear the $21,350 resistance zone, it could continue to move down. An immediate support on the downside is near the $22,000 zone.
The next major support is near the $19,500 and $19,400 levels. A downside break below the $19,400 level might send the price towards the $18,500 support.
Technical indicators:
Hourly MACD – The MACD is now losing pace in the bearish zone.
Hourly RSI (Relative Strength Index) – The RSI for BTC/USD is now recovering from the oversold levels.
Major Support Levels – $20,000, followed by $19,400.
Major Resistance Levels – $20,600, $21,000 and $21,350.
Tags: bitcoinbtcusdBTCUSDTxbtusd
NewsBTCRead More
U.S. spot bitcoin ETFs lost $2.97 billion across 10 trading days through Friday, the longest…
Bitcoin price started a fresh decline below the $73,800 zone. BTC is consolidating and might…
The creator of the Mayer Multiple argues bitcoin’s growing economic substance is compressing volatility and…
Prominent crypto analysis page XWIN Research Japan reports that Bitcoin has reached a new milestone:…
Bitcoin’s market cap has dropped to roughly $1.46 trillion, pushing it below several major technology…
Bitcoin’s return to $100,000 is still a popular target across the market for 2026, but…