Bitcoin is struggling below $24,500 against the US Dollar. BTC could continue to move down below the $23,650 and $23,500 support levels.
Bitcoin is slowly moving lower and trading well below the $25,000 level.
The price is now trading below the $24,200 level and the 100 hourly simple moving average.
There is a key bearish trend line forming with resistance near $24,020 on the hourly chart of the BTC/USD pair (data feed from Kraken).
The pair could extend losses below the $23,650 and $23,500 support levels in the near term.
Bitcoin Price Turns Red
Bitcoin price started a slow and steady decline from the $25,000 resistance zone. BTC declined below the $24,650 and $24,500 levels to move into a short-term bearish zone.
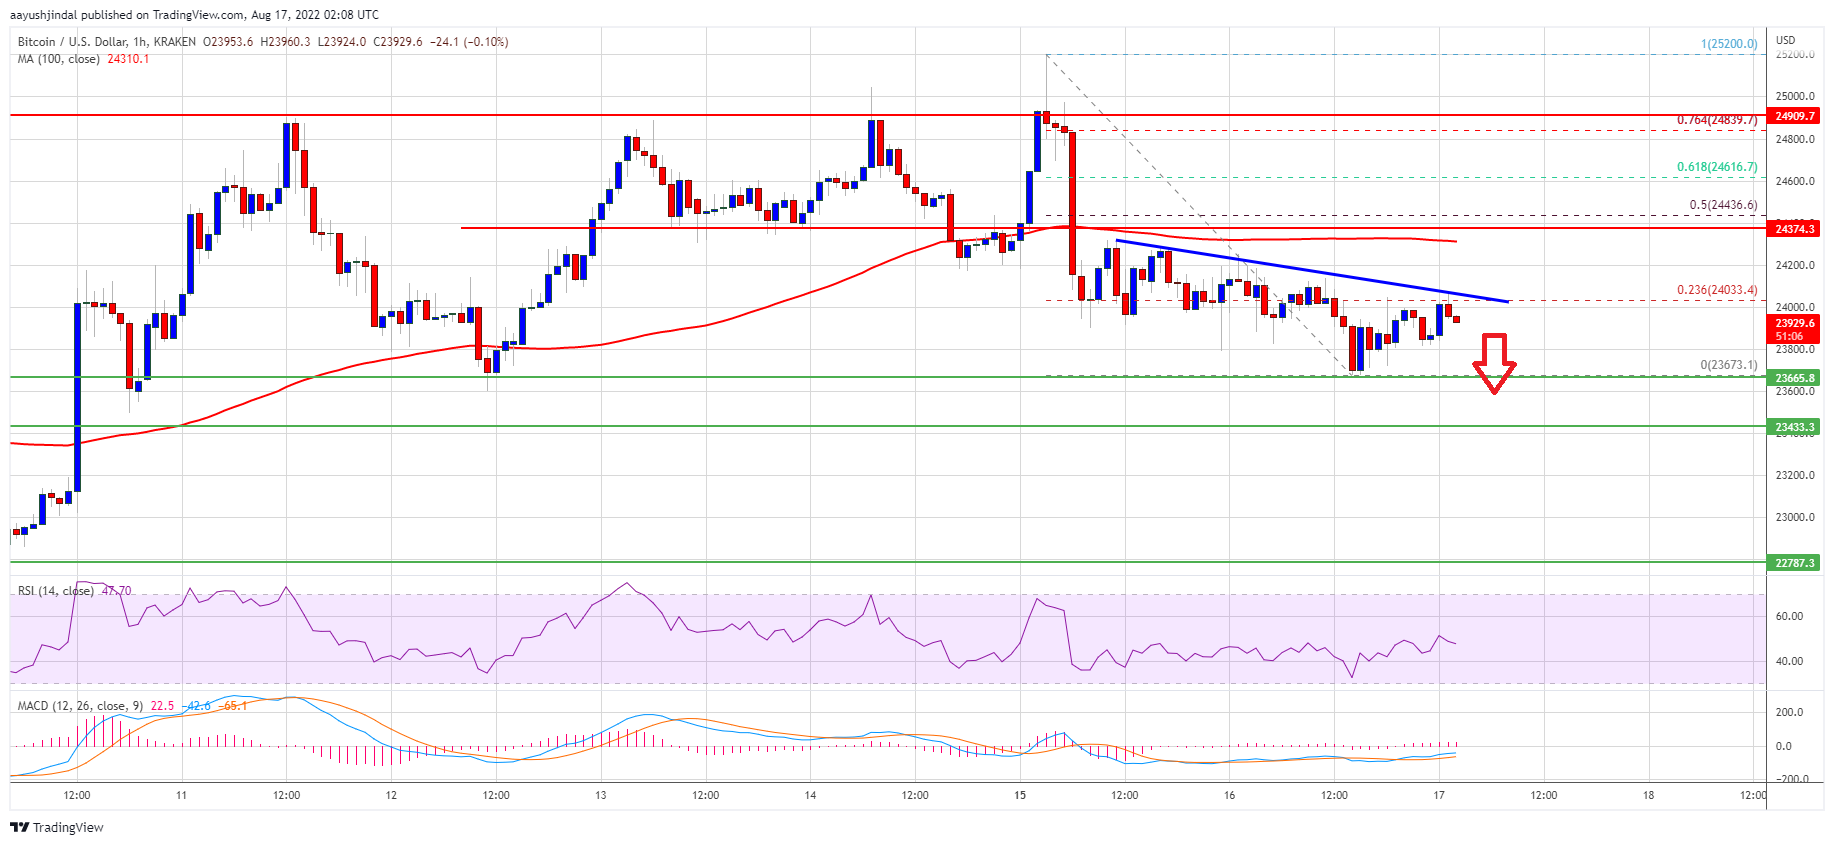
There was a break below the $24,000 level and the 100 hourly simple moving average. The price traded as low as $23,673 and is currently consolidating losses. On the upside, an immediate resistance is near the $24,000 level. It is near the 23.6% Fib retracement level of the recent drop from the $25,200 swing high to $23,673 low.
There is also a key bearish trend line forming with resistance near $24,020 on the hourly chart of the BTC/USD pair. The first major resistance on the upside sits near the $24,250 level and the 100 hourly simple moving average.
The next key resistance is near the $24,450 zone. It is near the 50% Fib retracement level of the recent drop from the $25,200 swing high to $23,673 low. A close above the $24,450 and $24,500 resistance levels might start another increase.
Source: BTCUSD on TradingView.com
In the stated case, the price may perhaps climb towards the $25,000 resistance. Any more gains might send the price towards the $25,800 level.
More Losses in BTC?
If bitcoin fails to clear the $24,450 resistance zone, it could continue to move down. An immediate support on the downside is near the $23,675 level.
The next major support now sits near the $23,450 level. A downside break and close below the $23,450 level might put a lot of pressure on the bulls. In the stated case, the price might decline towards the $22,750 level.
Technical indicators:
Hourly MACD – The MACD is now gaining pace in the bearish zone.
Hourly RSI (Relative Strength Index) – The RSI for BTC/USD is now below the 50 level.
Major Support Levels – $23,650, followed by $23,500.
Major Resistance Levels – $24,020, $24,450 and $24,500.
Bitcoin is struggling below $24,500 against the US Dollar. BTC could continue to move down below the $23,650 and $23,500 support levels.
Bitcoin is slowly moving lower and trading well below the $25,000 level.
The price is now trading below the $24,200 level and the 100 hourly simple moving average.
There is a key bearish trend line forming with resistance near $24,020 on the hourly chart of the BTC/USD pair (data feed from Kraken).
The pair could extend losses below the $23,650 and $23,500 support levels in the near term.
Bitcoin price started a slow and steady decline from the $25,000 resistance zone. BTC declined below the $24,650 and $24,500 levels to move into a short-term bearish zone.
There was a break below the $24,000 level and the 100 hourly simple moving average. The price traded as low as $23,673 and is currently consolidating losses. On the upside, an immediate resistance is near the $24,000 level. It is near the 23.6% Fib retracement level of the recent drop from the $25,200 swing high to $23,673 low.
There is also a key bearish trend line forming with resistance near $24,020 on the hourly chart of the BTC/USD pair. The first major resistance on the upside sits near the $24,250 level and the 100 hourly simple moving average.
The next key resistance is near the $24,450 zone. It is near the 50% Fib retracement level of the recent drop from the $25,200 swing high to $23,673 low. A close above the $24,450 and $24,500 resistance levels might start another increase.
Source: BTCUSD on TradingView.com
In the stated case, the price may perhaps climb towards the $25,000 resistance. Any more gains might send the price towards the $25,800 level.
If bitcoin fails to clear the $24,450 resistance zone, it could continue to move down. An immediate support on the downside is near the $23,675 level.
The next major support now sits near the $23,450 level. A downside break and close below the $23,450 level might put a lot of pressure on the bulls. In the stated case, the price might decline towards the $22,750 level.
Technical indicators:
Hourly MACD – The MACD is now gaining pace in the bearish zone.
Hourly RSI (Relative Strength Index) – The RSI for BTC/USD is now below the 50 level.
Major Support Levels – $23,650, followed by $23,500.
Major Resistance Levels – $24,020, $24,450 and $24,500.
Tags: bitcoinbtcusdBTCUSDTxbtusd
NewsBTCRead More
Each escalation in the Iran conflict has been larger than the last, but each bitcoin…
The Bitcoin price has not particularly impressed over the past two weeks, but it appears…
Bitcoin’s extended pullback from its all-time high has left traders in uncertainty, and many investors…
Bitcoin recently pushed into a key liquidity pocket near the $73,000 level, briefly tapping overhead…
The price of Bitcoin put in another interesting performance over the past week, as the…
Strategy’s stock is trading below the value of its own Bitcoin holdings — an unusual…