Bitcoin is facing a key resistance near the $23,500 zone against the US Dollar. BTC must clear $23,500 to avoid a fresh bearish reaction in the near term.
Bitcoin is struggling to rise and trading below the $23,500 level.
The price is now trading below the $23,200 level and the 100 hourly simple moving average.
There is a key rising channel forming with support near $22,800 on the hourly chart of the BTC/USD pair (data feed from Kraken).
The pair must clear the $23,500 resistance to start a decent increase in the near term.
Bitcoin Price Upsides Capped
Bitcoin price gained pace after it broke the $23,500 support zone. The price even traded below the $23,000 level to move into a short-term bearish zone.
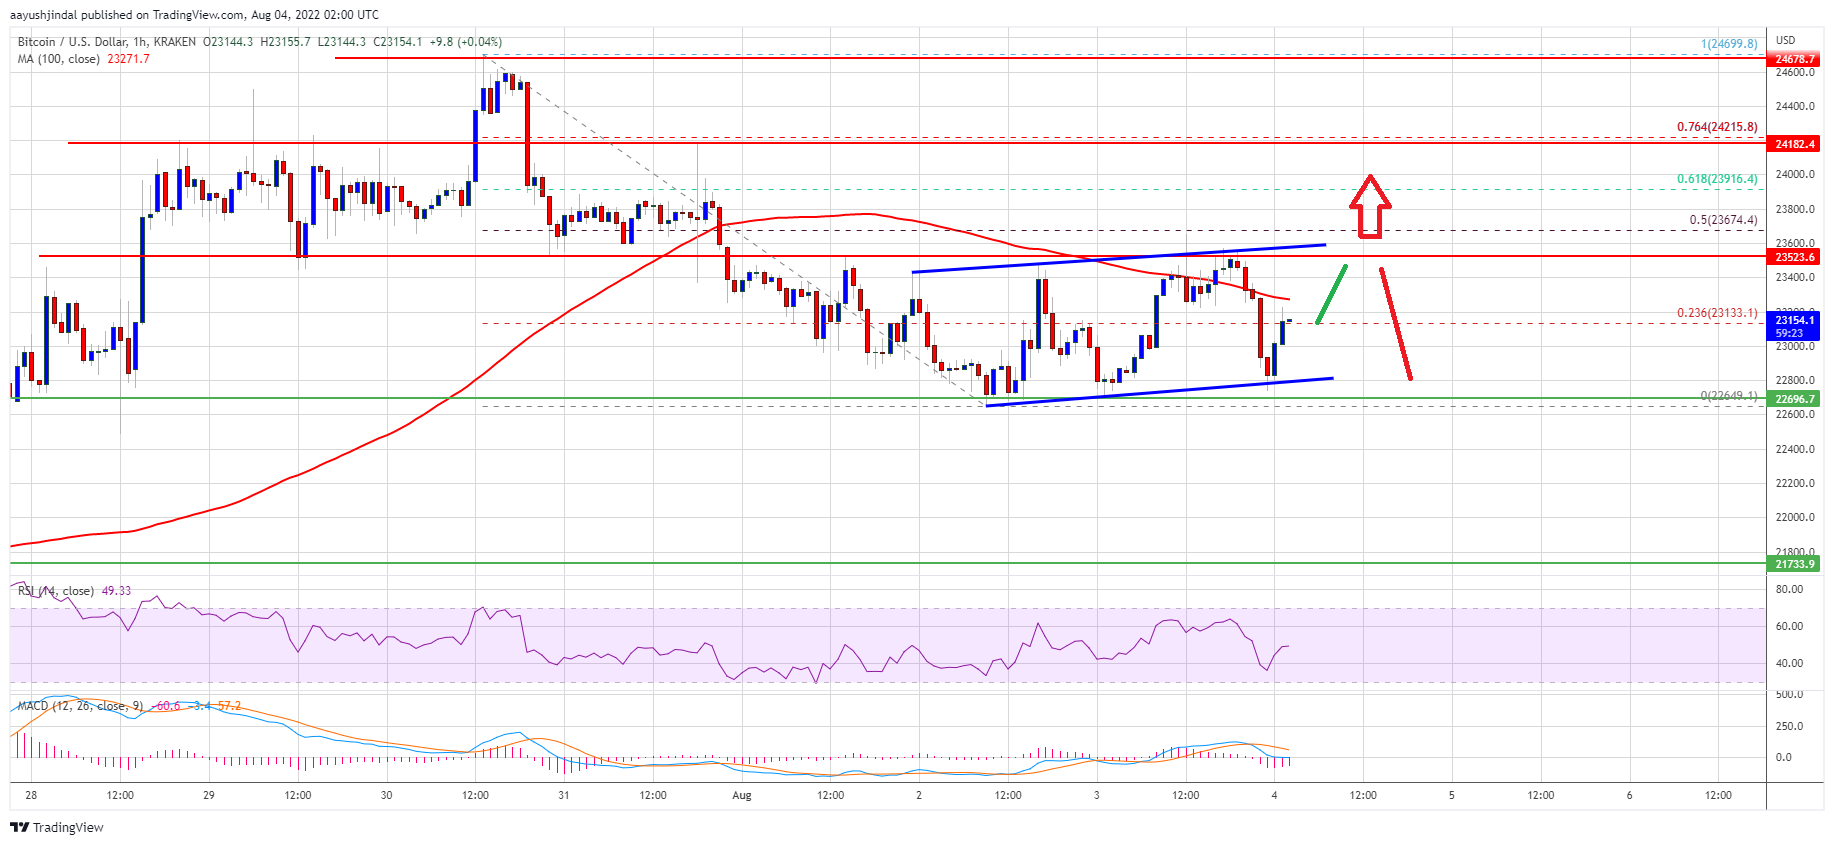
However, the bulls protected the $22,650 zone. The 50% Fib retracement level of the upward move from the $20,692 swing low to $24,671 high acted as a support. The price formed a base and recently recovered losses above the $23,000 level.
Bitcoin climbed above the 23.6% Fib retracement level of the downward move from the $24,699 swing high to $22,649 low. The price even spiked above the $23,400 level, but it faced a strong resistance near $23,500.
It is now trading below the $23,200 level and the 100 hourly simple moving average. There is also a key rising channel forming with support near $22,800 on the hourly chart of the BTC/USD pair. On the upside, bitcoin price is facing resistance near the $23,200 level and the 100 hourly SMA.
Source: BTCUSD on TradingView.com
The next key resistance is near the $23,500 zone. A close above the $23,500 resistance zone could set the pace for a decent increase. In the stated case, the price may perhaps rise towards the $24,215 level. The next major resistance sits near the $24,700 level.
More Losses in BTC?
If bitcoin fails to clear the $23,500 resistance zone and the channel resistance, it could continue to move down. An immediate support on the downside is near the $22,800 level.
The next major support now sits near the $22,640 level. A close below the $22,640 level might spark a sharp decline to $21,750. Any more losses might send the price towards $21,000 level.
Technical indicators:
Hourly MACD – The MACD is now gaining pace in the bearish zone.
Hourly RSI (Relative Strength Index) – The RSI for BTC/USD is now near the 50 level.
Major Support Levels – $22,800, followed by $22,500.
Major Resistance Levels – $23,200, $23,500 and $24,180.
Bitcoin is facing a key resistance near the $23,500 zone against the US Dollar. BTC must clear $23,500 to avoid a fresh bearish reaction in the near term.
Bitcoin is struggling to rise and trading below the $23,500 level.
The price is now trading below the $23,200 level and the 100 hourly simple moving average.
There is a key rising channel forming with support near $22,800 on the hourly chart of the BTC/USD pair (data feed from Kraken).
The pair must clear the $23,500 resistance to start a decent increase in the near term.
Bitcoin price gained pace after it broke the $23,500 support zone. The price even traded below the $23,000 level to move into a short-term bearish zone.
However, the bulls protected the $22,650 zone. The 50% Fib retracement level of the upward move from the $20,692 swing low to $24,671 high acted as a support. The price formed a base and recently recovered losses above the $23,000 level.
Bitcoin climbed above the 23.6% Fib retracement level of the downward move from the $24,699 swing high to $22,649 low. The price even spiked above the $23,400 level, but it faced a strong resistance near $23,500.
It is now trading below the $23,200 level and the 100 hourly simple moving average. There is also a key rising channel forming with support near $22,800 on the hourly chart of the BTC/USD pair. On the upside, bitcoin price is facing resistance near the $23,200 level and the 100 hourly SMA.
Source: BTCUSD on TradingView.com
The next key resistance is near the $23,500 zone. A close above the $23,500 resistance zone could set the pace for a decent increase. In the stated case, the price may perhaps rise towards the $24,215 level. The next major resistance sits near the $24,700 level.
If bitcoin fails to clear the $23,500 resistance zone and the channel resistance, it could continue to move down. An immediate support on the downside is near the $22,800 level.
The next major support now sits near the $22,640 level. A close below the $22,640 level might spark a sharp decline to $21,750. Any more losses might send the price towards $21,000 level.
Technical indicators:
Hourly MACD – The MACD is now gaining pace in the bearish zone.
Hourly RSI (Relative Strength Index) – The RSI for BTC/USD is now near the 50 level.
Major Support Levels – $22,800, followed by $22,500.
Major Resistance Levels – $23,200, $23,500 and $24,180.
Tags: bitcoinbtcusdBTCUSDTxbtusd
NewsBTCRead More
Bitcoin Magazine Corporate Bitcoin Holdings Hit Record High as Institutions Accumulate 2.8x Mining Supply: Report…
Research shows that only 8% to 10% of global Bitcoin hashrate runs in oil-sensitive power…
Today’s quantum computers are far from breaking Bitcoin’s cryptography and any real threat would likely…
U.S. President Trump said stopping Iran is more of a concern than oil prices, as…
Crypto analyst Leshka has explained why it is unlikely that the Bitcoin price has bottomed…
Glassnode’s Accumulation Trend Score drops to 0.04 as smaller wallet cohorts offload BTC while macro…