Bitcoin price started a fresh decline from the $24,250 resistance zone against the US Dollar. BTC declined below $23,000 and remains at a risk of more losses.
Bitcoin started a fresh decline below the $23,500 support zone.
The price is now trading below the $23,500 level and the 100 hourly simple moving average.
There was a break below a major bullish trend line with support near $23,320 on the hourly chart of the BTC/USD pair (data feed from Kraken).
The pair must clear the $23,250 resistance to start a fresh increase in the near term.
Bitcoin Price Breaks Support
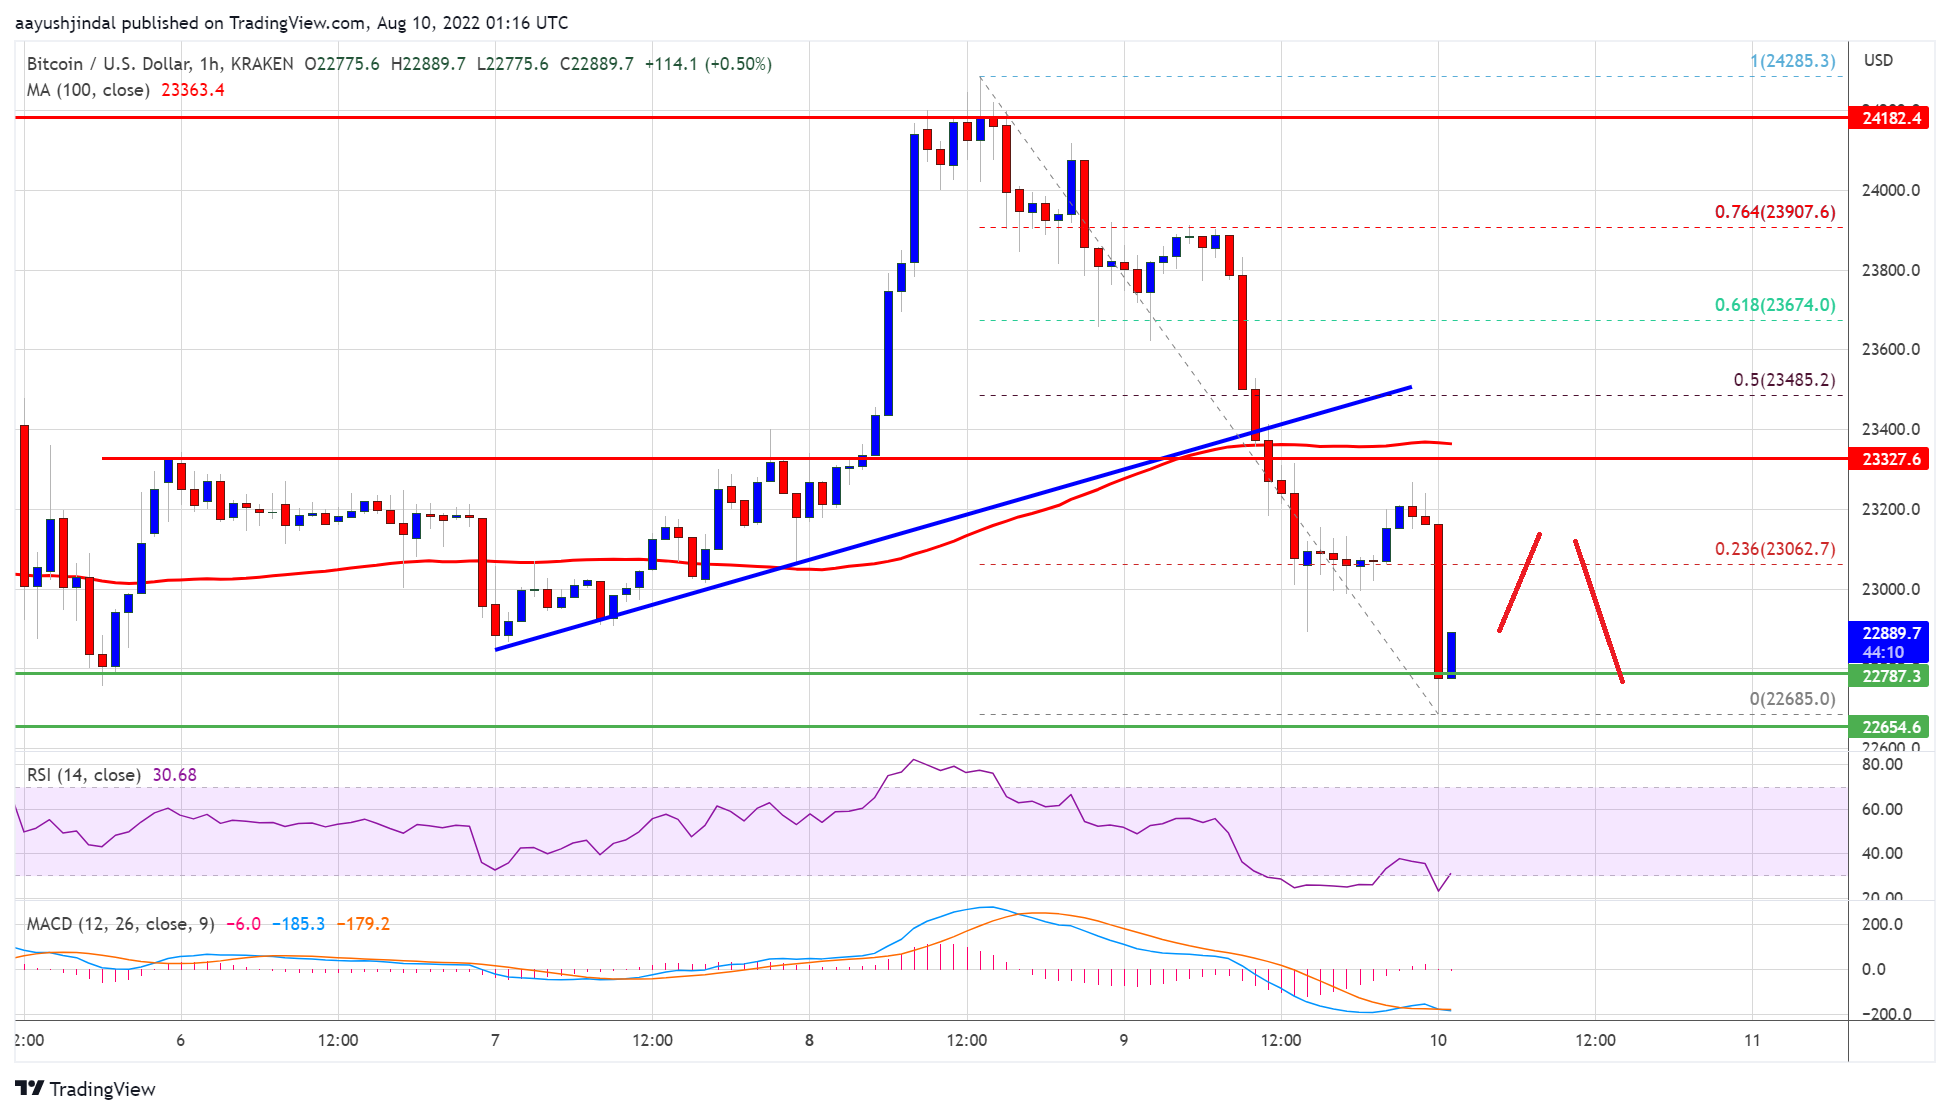
Bitcoin price struggled to gain pace above the $24,000 resistance zone. The price formed a top near $24,285 and started a fresh decline.
There was a clear move below the $23,800 and $23,500 support levels. The bears pushed the pair below the 61.8% Fib retracement level of the upward move from the $22,846 swing low to $24,286 high. Besides, there was a break below a major bullish trend line with support near $23,320 on the hourly chart of the BTC/USD pair.
Bitcoin price is now trading below the $23,500 level and the 100 hourly simple moving average. It is now consolidating above the key $22,650 support zone.
Source: BTCUSD on TradingView.com
On the upside, an immediate resistance is near the $23,250 level. The next key resistance is near the $23,500 zone. A close above the $23,500 resistance zone could start a steady increase. In the stated case, the price may perhaps rise clear the $24,000 resistance.
Downside Break in BTC?
If bitcoin fails to clear the $23,500 resistance zone, it could continue to mov down. An immediate support on the downside is near the $22,650 level.
The next major support now sits near the $22,500 level. A close below the $22,500 level might start a move towards $22,000. If the bears remain in action, there is a risk of a move towards the $21,500 level in the coming sessions. Any more losses might send the price towards $20,500 level.
Technical indicators:
Hourly MACD – The MACD is now gaining pace in the bearish zone.
Hourly RSI (Relative Strength Index) – The RSI for BTC/USD is now well below the 50 level.
Major Support Levels – $22,650, followed by $22,500.
Major Resistance Levels – $23,250, $23,500 and $24,000.
Bitcoin price started a fresh decline from the $24,250 resistance zone against the US Dollar. BTC declined below $23,000 and remains at a risk of more losses.
Bitcoin started a fresh decline below the $23,500 support zone.
The price is now trading below the $23,500 level and the 100 hourly simple moving average.
There was a break below a major bullish trend line with support near $23,320 on the hourly chart of the BTC/USD pair (data feed from Kraken).
The pair must clear the $23,250 resistance to start a fresh increase in the near term.
Bitcoin price struggled to gain pace above the $24,000 resistance zone. The price formed a top near $24,285 and started a fresh decline.
There was a clear move below the $23,800 and $23,500 support levels. The bears pushed the pair below the 61.8% Fib retracement level of the upward move from the $22,846 swing low to $24,286 high. Besides, there was a break below a major bullish trend line with support near $23,320 on the hourly chart of the BTC/USD pair.
Bitcoin price is now trading below the $23,500 level and the 100 hourly simple moving average. It is now consolidating above the key $22,650 support zone.
Source: BTCUSD on TradingView.com
On the upside, an immediate resistance is near the $23,250 level. The next key resistance is near the $23,500 zone. A close above the $23,500 resistance zone could start a steady increase. In the stated case, the price may perhaps rise clear the $24,000 resistance.
If bitcoin fails to clear the $23,500 resistance zone, it could continue to mov down. An immediate support on the downside is near the $22,650 level.
The next major support now sits near the $22,500 level. A close below the $22,500 level might start a move towards $22,000. If the bears remain in action, there is a risk of a move towards the $21,500 level in the coming sessions. Any more losses might send the price towards $20,500 level.
Technical indicators:
Hourly MACD – The MACD is now gaining pace in the bearish zone.
Hourly RSI (Relative Strength Index) – The RSI for BTC/USD is now well below the 50 level.
Major Support Levels – $22,650, followed by $22,500.
Major Resistance Levels – $23,250, $23,500 and $24,000.
Tags: bitcoinbtcusdBTCUSDTxbtusd
NewsBTCRead More
In the middle of a surge higher following President Trump's overnight comments, the price of…
Bitcoin Magazine Bitcoin Treasuries Are Cracking as Public Companies Turn into BTC Sellers A wave…
Bitcoin Magazine Bitcoin Price Continues Sliding as President Trump Signals Iran Escalation, Raising Risk of…
Long term holder trends suggest a maturing bear market, yet extended consolidation could test investor…
Bitcoin’s recent price structure has not been easy to sit through. The price action has…
Bitcoin Magazine Metaplanet Surpasses MARA Holdings to Become Third-Largest Corporate Bitcoin Holder Tokyo-listed Metaplanet has…