Bitcoin gained pace above the $23,000 resistance against the US Dollar. BTC could rise further towards $24,000 if it stays above the $22,750 support.
Bitcoin climbed over 5% and there was a move above the $23,000 resistance zone.
The price is now trading above the $22,750 level and testing the 100 hourly simple moving average.
There is a major bullish trend line forming with support near $22,750 on the hourly chart of the BTC/USD pair (data feed from Kraken).
The pair might continue to rise if it clears the $23,500 and $22,750 levels.
Bitcoin Price Starts Fresh Increase
Bitcoin price started a decent increase after it managed to settle above the $22,000 resistance zone. BTC gained pace for a move above the $23,000 resistance level.
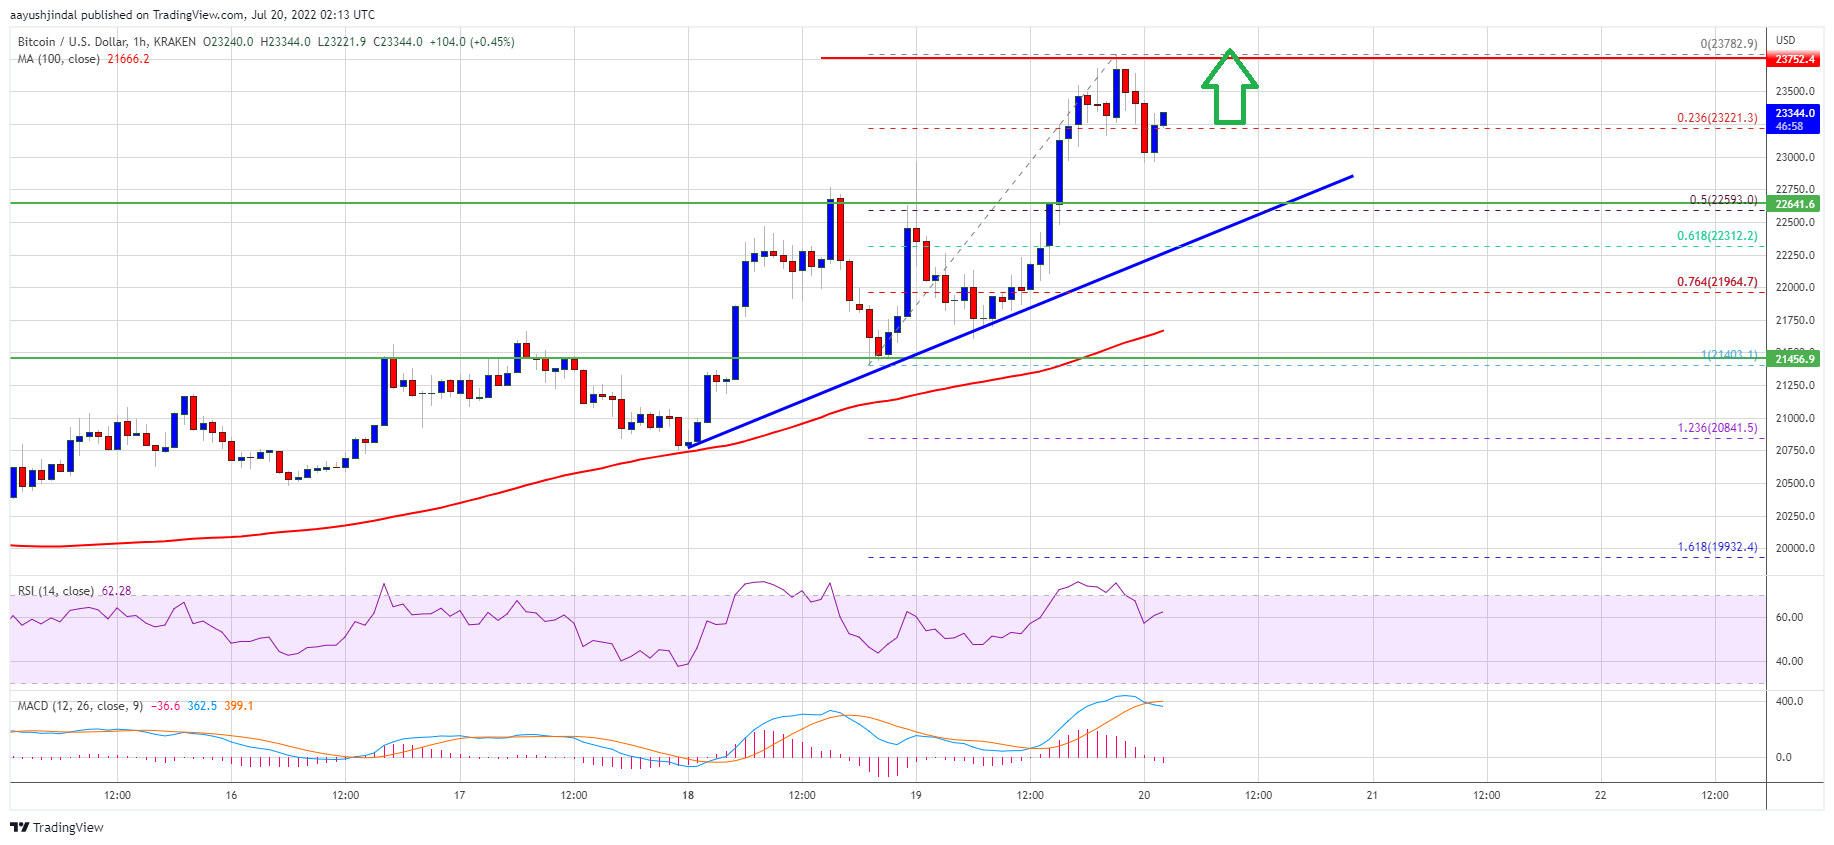
The price even broke the $23,500 level and settled above the 100 hourly simple moving average. A high was formed near $23,782 and the price is now consolidating gains. There was a minor downside correction below the $23,500 level.
Bitcoin traded below the 23.6% Fib retracement level of the upward move from the $21,403 swing low to $23,782 high. However, the bulls were active near the $23,000 support zone.
There is also a major bullish trend line forming with support near $22,750 on the hourly chart of the BTC/USD pair. On the upside, bitcoin price could face resistance near the $23,500 level. The next key resistance is near the $23,750 zone.
Source: BTCUSD on TradingView.com
A close above the $23,750 resistance zone could set the pace for more upsides. In the stated case, the price may perhaps rise towards the $24,000 level. The next major resistance sits near the $24,500 level.
Dips Supported in BTC?
If bitcoin fails to clear the $23,500 resistance zone, it could start a downside correction. An immediate support on the downside is near the $23,000 level.
The next major support now sits near the $22,750 level and the trend line zone. It is also close to the 50% Fib retracement level of the upward move from the $21,403 swing low to $23,782 high. A clear move below the trend line support might send the price towards $21,500.
Technical indicators:
Hourly MACD – The MACD is now gaining pace in the bullish zone.
Hourly RSI (Relative Strength Index) – The RSI for BTC/USD is now above the 50 level.
Major Support Levels – $22,750, followed by $22,500.
Major Resistance Levels – $23,500, $23,750 and $24,000.
Bitcoin gained pace above the $23,000 resistance against the US Dollar. BTC could rise further towards $24,000 if it stays above the $22,750 support.
Bitcoin climbed over 5% and there was a move above the $23,000 resistance zone.
The price is now trading above the $22,750 level and testing the 100 hourly simple moving average.
There is a major bullish trend line forming with support near $22,750 on the hourly chart of the BTC/USD pair (data feed from Kraken).
The pair might continue to rise if it clears the $23,500 and $22,750 levels.
Bitcoin price started a decent increase after it managed to settle above the $22,000 resistance zone. BTC gained pace for a move above the $23,000 resistance level.
The price even broke the $23,500 level and settled above the 100 hourly simple moving average. A high was formed near $23,782 and the price is now consolidating gains. There was a minor downside correction below the $23,500 level.
Bitcoin traded below the 23.6% Fib retracement level of the upward move from the $21,403 swing low to $23,782 high. However, the bulls were active near the $23,000 support zone.
There is also a major bullish trend line forming with support near $22,750 on the hourly chart of the BTC/USD pair. On the upside, bitcoin price could face resistance near the $23,500 level. The next key resistance is near the $23,750 zone.
Source: BTCUSD on TradingView.com
A close above the $23,750 resistance zone could set the pace for more upsides. In the stated case, the price may perhaps rise towards the $24,000 level. The next major resistance sits near the $24,500 level.
If bitcoin fails to clear the $23,500 resistance zone, it could start a downside correction. An immediate support on the downside is near the $23,000 level.
The next major support now sits near the $22,750 level and the trend line zone. It is also close to the 50% Fib retracement level of the upward move from the $21,403 swing low to $23,782 high. A clear move below the trend line support might send the price towards $21,500.
Technical indicators:
Hourly MACD – The MACD is now gaining pace in the bullish zone.
Hourly RSI (Relative Strength Index) – The RSI for BTC/USD is now above the 50 level.
Major Support Levels – $22,750, followed by $22,500.
Major Resistance Levels – $23,500, $23,750 and $24,000.
Tags: bitcoinbtcusdBTCUSDTxbtusd
FeedzyRead More
Your day-ahead look for July 22, 2026Read MoreCoinDesk: Bitcoin, Ethereum, Crypto News and Price Data[#item_full_content]
BTC retreated from a one-month high as WTI crude topped $85 for the first time…
An attacker fed the lending system a fake, abnormally low bitcoin price, liquidated vaults that…
A two-day chip rebound stalled ahead of Alphabet's earnings in a sign of whether the…
Semiconductor stocks led a second day of gains on AI optimism, while the yen slid…
Bitcoin Magazine Bitcoin Maxi Jack Dorsey Unveils New Open Source Group Chat App Tech entrepreneur…