Bitcoin gained pace above the $23,000 resistance against the US Dollar. BTC could rise further towards $24,000 if it stays above the $22,750 support.
Bitcoin climbed over 5% and there was a move above the $23,000 resistance zone.
The price is now trading above the $22,750 level and testing the 100 hourly simple moving average.
There is a major bullish trend line forming with support near $22,750 on the hourly chart of the BTC/USD pair (data feed from Kraken).
The pair might continue to rise if it clears the $23,500 and $22,750 levels.
Bitcoin Price Starts Fresh Increase
Bitcoin price started a decent increase after it managed to settle above the $22,000 resistance zone. BTC gained pace for a move above the $23,000 resistance level.
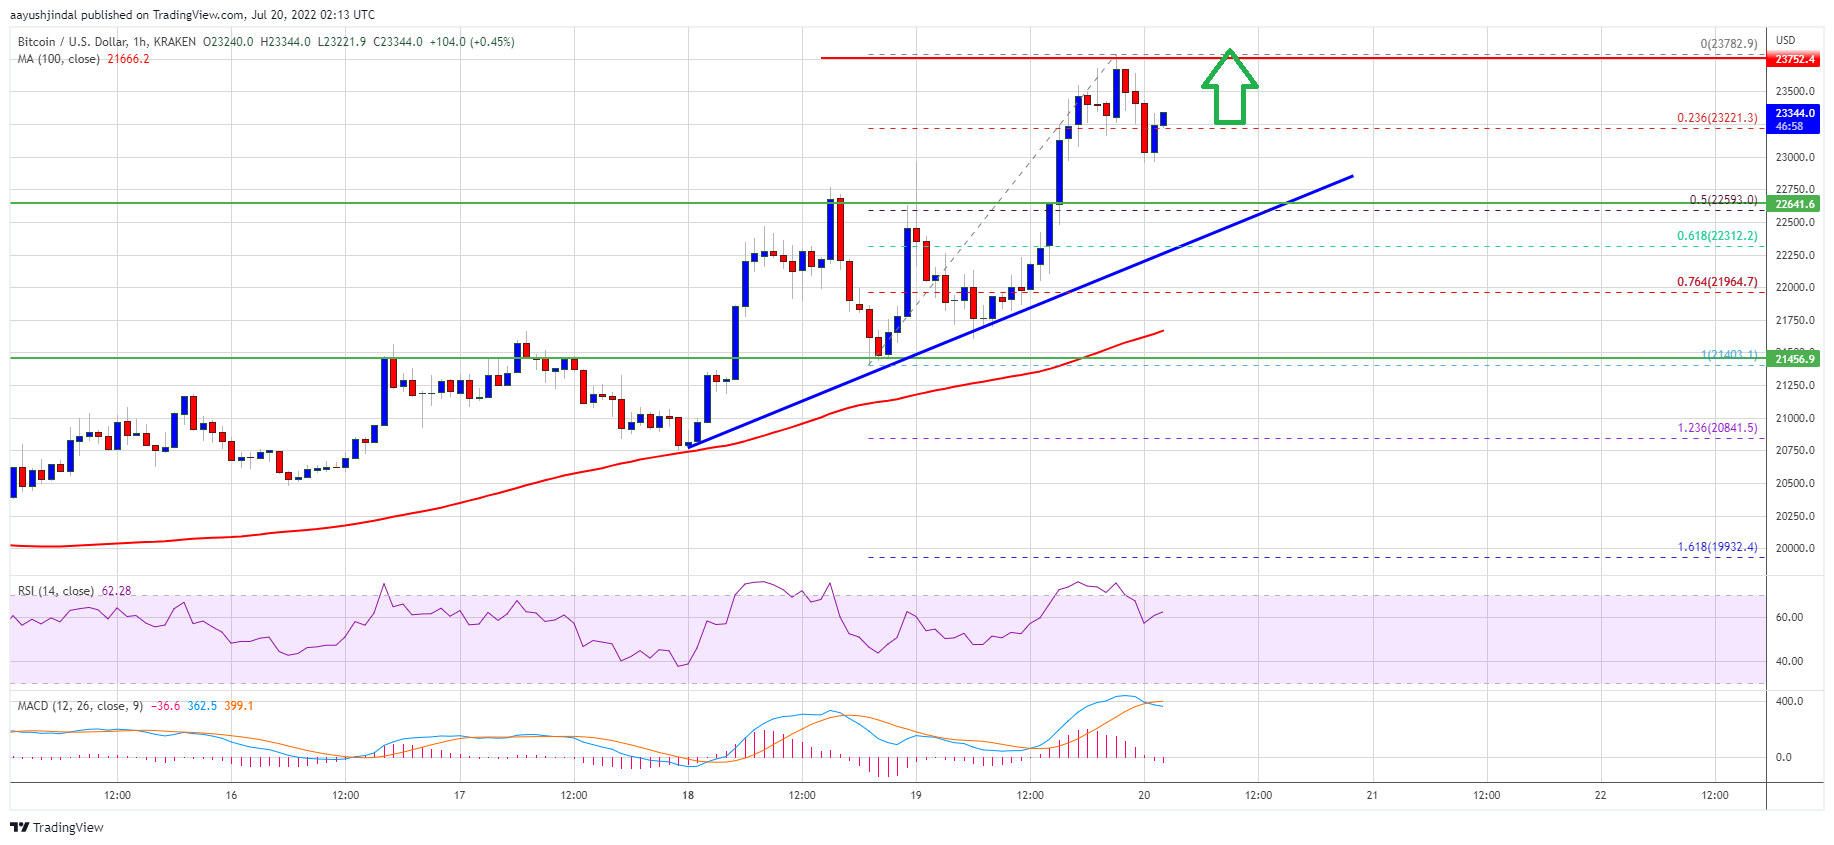
The price even broke the $23,500 level and settled above the 100 hourly simple moving average. A high was formed near $23,782 and the price is now consolidating gains. There was a minor downside correction below the $23,500 level.
Bitcoin traded below the 23.6% Fib retracement level of the upward move from the $21,403 swing low to $23,782 high. However, the bulls were active near the $23,000 support zone.
There is also a major bullish trend line forming with support near $22,750 on the hourly chart of the BTC/USD pair. On the upside, bitcoin price could face resistance near the $23,500 level. The next key resistance is near the $23,750 zone.
Source: BTCUSD on TradingView.com
A close above the $23,750 resistance zone could set the pace for more upsides. In the stated case, the price may perhaps rise towards the $24,000 level. The next major resistance sits near the $24,500 level.
Dips Supported in BTC?
If bitcoin fails to clear the $23,500 resistance zone, it could start a downside correction. An immediate support on the downside is near the $23,000 level.
The next major support now sits near the $22,750 level and the trend line zone. It is also close to the 50% Fib retracement level of the upward move from the $21,403 swing low to $23,782 high. A clear move below the trend line support might send the price towards $21,500.
Technical indicators:
Hourly MACD – The MACD is now gaining pace in the bullish zone.
Hourly RSI (Relative Strength Index) – The RSI for BTC/USD is now above the 50 level.
Major Support Levels – $22,750, followed by $22,500.
Major Resistance Levels – $23,500, $23,750 and $24,000.
Bitcoin gained pace above the $23,000 resistance against the US Dollar. BTC could rise further towards $24,000 if it stays above the $22,750 support.
Bitcoin climbed over 5% and there was a move above the $23,000 resistance zone.
The price is now trading above the $22,750 level and testing the 100 hourly simple moving average.
There is a major bullish trend line forming with support near $22,750 on the hourly chart of the BTC/USD pair (data feed from Kraken).
The pair might continue to rise if it clears the $23,500 and $22,750 levels.
Bitcoin price started a decent increase after it managed to settle above the $22,000 resistance zone. BTC gained pace for a move above the $23,000 resistance level.
The price even broke the $23,500 level and settled above the 100 hourly simple moving average. A high was formed near $23,782 and the price is now consolidating gains. There was a minor downside correction below the $23,500 level.
Bitcoin traded below the 23.6% Fib retracement level of the upward move from the $21,403 swing low to $23,782 high. However, the bulls were active near the $23,000 support zone.
There is also a major bullish trend line forming with support near $22,750 on the hourly chart of the BTC/USD pair. On the upside, bitcoin price could face resistance near the $23,500 level. The next key resistance is near the $23,750 zone.
Source: BTCUSD on TradingView.com
A close above the $23,750 resistance zone could set the pace for more upsides. In the stated case, the price may perhaps rise towards the $24,000 level. The next major resistance sits near the $24,500 level.
If bitcoin fails to clear the $23,500 resistance zone, it could start a downside correction. An immediate support on the downside is near the $23,000 level.
The next major support now sits near the $22,750 level and the trend line zone. It is also close to the 50% Fib retracement level of the upward move from the $21,403 swing low to $23,782 high. A clear move below the trend line support might send the price towards $21,500.
Technical indicators:
Hourly MACD – The MACD is now gaining pace in the bullish zone.
Hourly RSI (Relative Strength Index) – The RSI for BTC/USD is now above the 50 level.
Major Support Levels – $22,750, followed by $22,500.
Major Resistance Levels – $23,500, $23,750 and $24,000.
Tags: bitcoinbtcusdBTCUSDTxbtusd
FeedzyRead More
Bitcoin quietly gained ground while gold crumbled. That contrast has become one of the more…
Despite stabilizing spot prices, investors remain defensive, with leveraged speculation cooling and realized volatility dropping…
Crypto analyst Ardi has pointed to a bear market divergence to explain what has been…
Bitcoin is hovering near the $71,000 mark, consolidating after recent swings as the market digests…
First-quarter purchases have reached 89,618 BTC so far, the most since fourth-quarter 2024, and the…
Bitcoin (BTC) is showing early signs of a prolonged decline after peaking in October 2025.…