Bitcoin is struggling to settle above $20,500 against the US Dollar. BTC could decline heavily if there is a clear move below the $19,500 support zone.
Bitcoin is stuck near the $20,000 zone and trading below the $20,500 resistance.
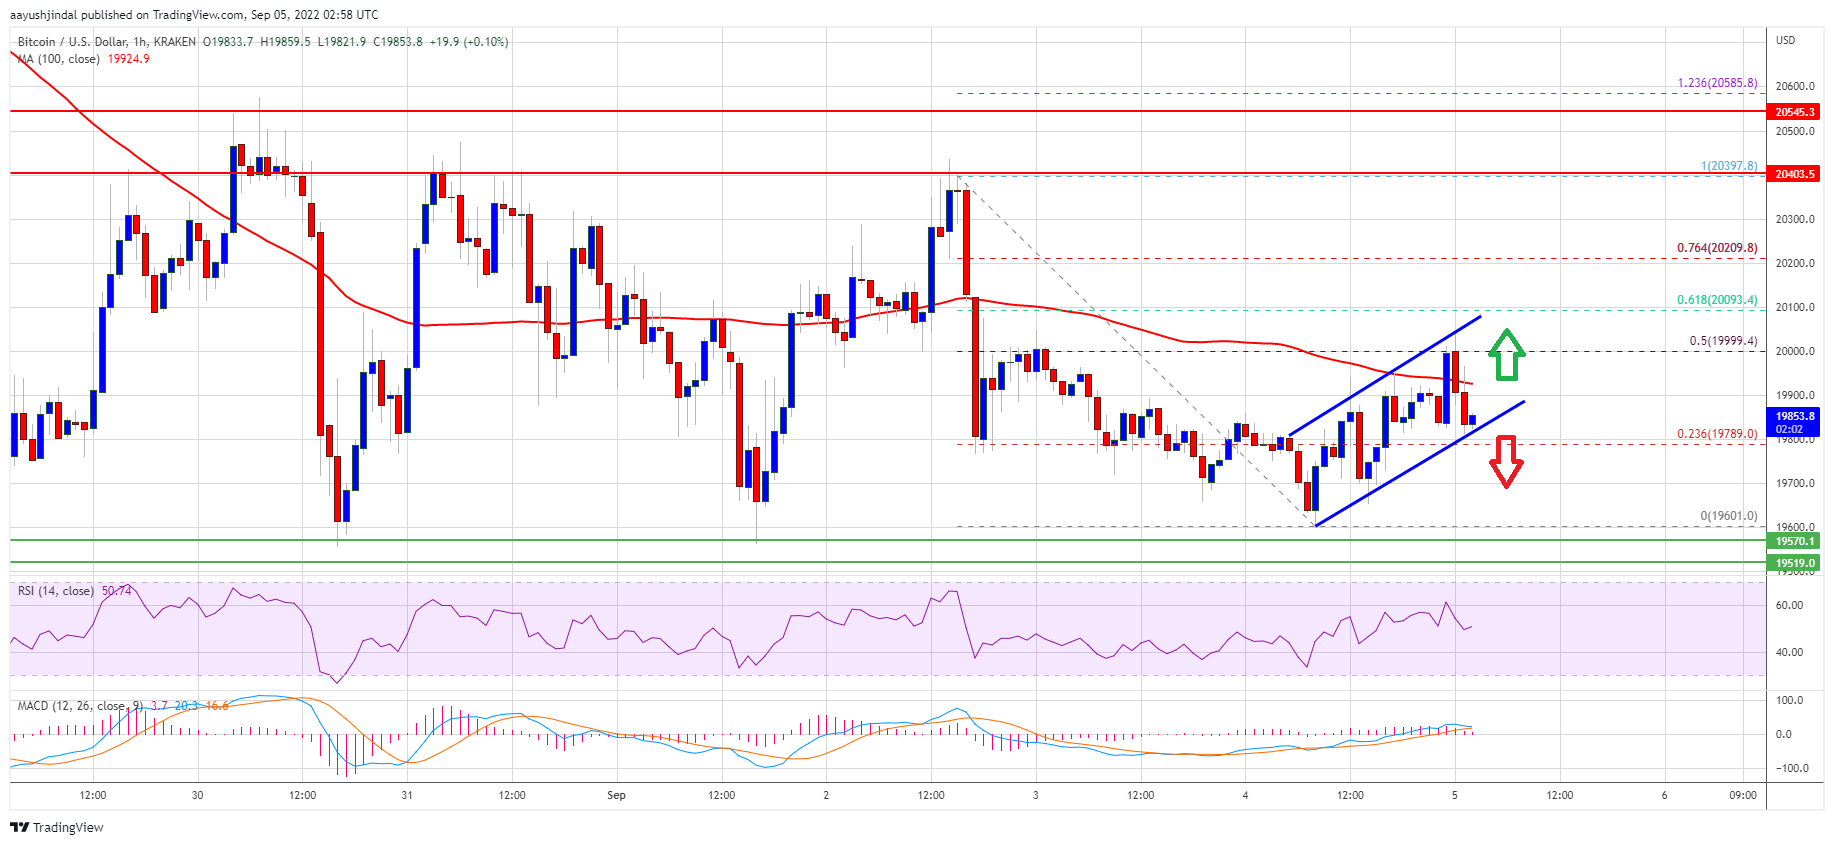
The price is now trading below the $20,000 level and the 100 hourly simple moving average.
There is a short-term rising channel forming with support near $19,750 on the hourly chart of the BTC/USD pair (data feed from Kraken).
The pair could accelerate lower if there is a clear move below the $19,600 and $19,500 levels.
Bitcoin Price Remains in a Range
Bitcoin price traded in a range below the $20,500 and $20,550 resistance levels. BTC failed on many occasions to clear the $20,500 resistance zone.
At the same time, the bulls were active above the $19,500 support zone. The recent low was formed near $19,600 and the price is now moving higher in the range. There was a minor increase above the $19,750 resistance zone. The price climbed above the 23.6% Fib retracement level of the recent decline from the $20,397 swing high to $19,600 low.
Bitcoin price is now trading below the $20,000 level and the 100 hourly simple moving average. There is also a short-term rising channel forming with support near $19,750 on the hourly chart of the BTC/USD pair.
On the upside, an immediate resistance is near the $19,900 level and the 100 hourly simple moving average. The next major resistance sits near the $20,000 level. It is near the 50% Fib retracement level of the recent decline from the $20,397 swing high to $19,600 low.
Source: BTCUSD on TradingView.com
A clear move above the $20,000 resistance might send the price towards $20,500. Any more gains might start a steady move towards the $21,200 resistance zone.
Downside Break in BTC?
If bitcoin fails to clear the $20,500 resistance zone, it could start another decline. An immediate support on the downside is near the $19,750 zone.
The next major support sits near the $19,600 level. The main support sits near the $19,500 level. A break below the $19,500 support might spark a sharp decline towards $18,800. Any more losses might call for a move to $18,500 in the near term.
Technical indicators:
Hourly MACD – The MACD is now losing pace in the bullish zone.
Hourly RSI (Relative Strength Index) – The RSI for BTC/USD is now above the 50 level.
Major Support Levels – $19,750, followed by $19,500.
Major Resistance Levels – $20,000, $20,350 and $20,500.
Bitcoin is struggling to settle above $20,500 against the US Dollar. BTC could decline heavily if there is a clear move below the $19,500 support zone.
Bitcoin is stuck near the $20,000 zone and trading below the $20,500 resistance.
The price is now trading below the $20,000 level and the 100 hourly simple moving average.
There is a short-term rising channel forming with support near $19,750 on the hourly chart of the BTC/USD pair (data feed from Kraken).
The pair could accelerate lower if there is a clear move below the $19,600 and $19,500 levels.
Bitcoin price traded in a range below the $20,500 and $20,550 resistance levels. BTC failed on many occasions to clear the $20,500 resistance zone.
At the same time, the bulls were active above the $19,500 support zone. The recent low was formed near $19,600 and the price is now moving higher in the range. There was a minor increase above the $19,750 resistance zone. The price climbed above the 23.6% Fib retracement level of the recent decline from the $20,397 swing high to $19,600 low.
Bitcoin price is now trading below the $20,000 level and the 100 hourly simple moving average. There is also a short-term rising channel forming with support near $19,750 on the hourly chart of the BTC/USD pair.
On the upside, an immediate resistance is near the $19,900 level and the 100 hourly simple moving average. The next major resistance sits near the $20,000 level. It is near the 50% Fib retracement level of the recent decline from the $20,397 swing high to $19,600 low.
Source: BTCUSD on TradingView.com
A clear move above the $20,000 resistance might send the price towards $20,500. Any more gains might start a steady move towards the $21,200 resistance zone.
If bitcoin fails to clear the $20,500 resistance zone, it could start another decline. An immediate support on the downside is near the $19,750 zone.
The next major support sits near the $19,600 level. The main support sits near the $19,500 level. A break below the $19,500 support might spark a sharp decline towards $18,800. Any more losses might call for a move to $18,500 in the near term.
Technical indicators:
Hourly MACD – The MACD is now losing pace in the bullish zone.
Hourly RSI (Relative Strength Index) – The RSI for BTC/USD is now above the 50 level.
Major Support Levels – $19,750, followed by $19,500.
Major Resistance Levels – $20,000, $20,350 and $20,500.
Tags: bitcoinbtcusdBTCUSDTxbtusd
NewsBTCRead More
The strategic move cuts debt, reduces dilution risk, and strengthens the balance sheet for expansion…
Your day-ahead look for March 26, 2026Read MoreCoinDesk: Bitcoin, Ethereum, Crypto News and Price Data[#item_full_content]
Extended range-bound price action signals structural consolidation rather than a textbook bearish continuation, despite rising…
Bitcoin has clawed its way back toward $70,000 after a sharp slide to roughly $67,000,…
Strategy accounted for nearly all recent BTC digital-asset treasury purchases, with other firms’ share dropping…
The Bitcoin price topped slightly above $126,000 back in October 2026 and is now down…