Bitcoin failed again to clear the $30,600 resistance zone against the US Dollar. BTC is declining, but the bulls might remain active near $28,500.
Bitcoin failed to gain strength for a move above the $30,600 resistance zone.
The price is now trading below the $30,000 level and the 100 hourly simple moving average.
There was break below a major bullish trend line with support near $29,800 on the hourly chart of the BTC/USD pair (data feed from Kraken).
The pair could continue to move down towards the main $28,700 support zone.
Bitcoin Price Tops Again
Bitcoin price attempted a fresh increase from the $28,500 support zone. There was a clear move above $30,000 resistance zone and the 100 hourly simple moving average.
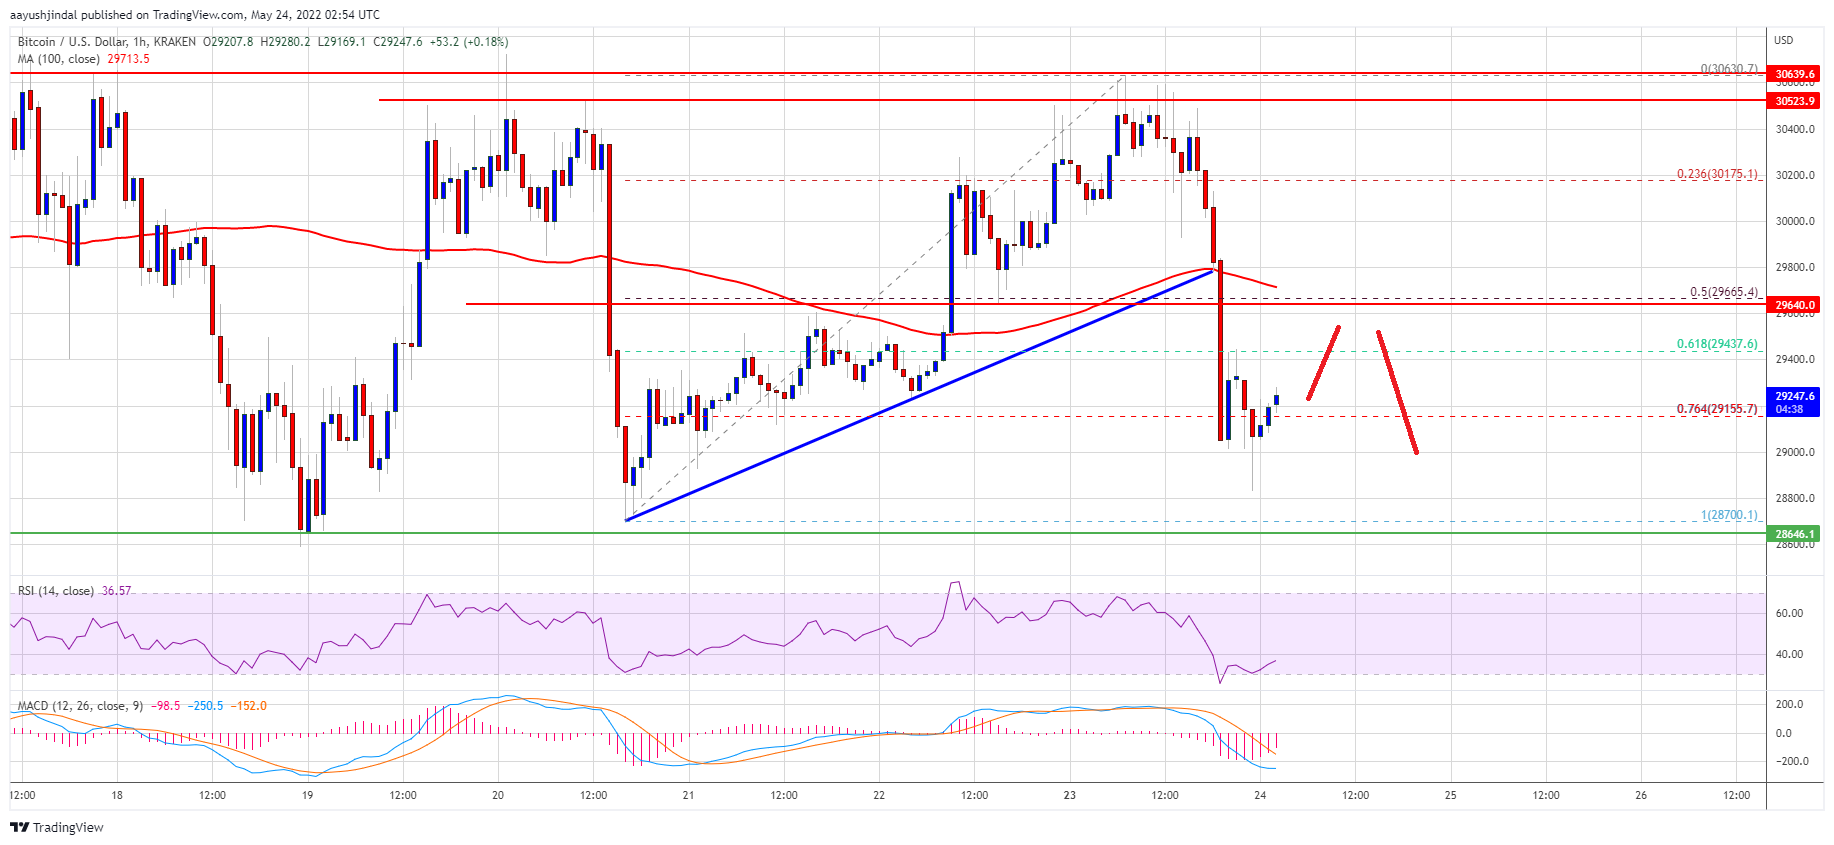
However, the bears were again active near the $30,600 resistance zone. A high was formed near $30,630 and the price started another decline. There was a sharp reaction below the $30,000 support zone and the 100 hourly simple moving average.
Bitcoin traded below the 50% Fib retracement level of the upward move from the $28,700 swing low to $30,630 high. Besides, there was break below a major bullish trend line with support near $29,800 on the hourly chart of the BTC/USD pair.
The price even spiked below the 76.4% Fib retracement level of the upward move from the $28,700 swing low to $30,630 high. It is now consolidating, with an immediate resistance near the $29,500 level.
Source: BTCUSD on TradingView.com
The next major resistance is near the $29,650 level and the 100 hourly SMA. The first key resistance is near the $30,000 level. A clear move above the $30,000 resistance level might send the price towards the main $30,600 resistance zone.
More Losses in BTC?
If bitcoin fails to clear the $29,650 resistance zone, it could continue to move down. An immediate support on the downside is near the $29,000 level.
The first major support is near the $28,850 level. The main support sits near the $28,500 level. A clear move below the $28,500 support zone may perhaps start a major decline. In the stated case, the price could dive to $27,800.
Technical indicators:
Hourly MACD – The MACD is now slowly losing pace in the bearish zone.
Hourly RSI (Relative Strength Index) – The RSI for BTC/USD is now below the 50 level.
Major Support Levels – $28,850, followed by $28,500.
Major Resistance Levels – $29,650, $30,000 and $30,600.
Bitcoin failed again to clear the $30,600 resistance zone against the US Dollar. BTC is declining, but the bulls might remain active near $28,500.
Bitcoin failed to gain strength for a move above the $30,600 resistance zone.
The price is now trading below the $30,000 level and the 100 hourly simple moving average.
There was break below a major bullish trend line with support near $29,800 on the hourly chart of the BTC/USD pair (data feed from Kraken).
The pair could continue to move down towards the main $28,700 support zone.
Bitcoin price attempted a fresh increase from the $28,500 support zone. There was a clear move above $30,000 resistance zone and the 100 hourly simple moving average.
However, the bears were again active near the $30,600 resistance zone. A high was formed near $30,630 and the price started another decline. There was a sharp reaction below the $30,000 support zone and the 100 hourly simple moving average.
Bitcoin traded below the 50% Fib retracement level of the upward move from the $28,700 swing low to $30,630 high. Besides, there was break below a major bullish trend line with support near $29,800 on the hourly chart of the BTC/USD pair.
The price even spiked below the 76.4% Fib retracement level of the upward move from the $28,700 swing low to $30,630 high. It is now consolidating, with an immediate resistance near the $29,500 level.
Source: BTCUSD on TradingView.com
The next major resistance is near the $29,650 level and the 100 hourly SMA. The first key resistance is near the $30,000 level. A clear move above the $30,000 resistance level might send the price towards the main $30,600 resistance zone.
If bitcoin fails to clear the $29,650 resistance zone, it could continue to move down. An immediate support on the downside is near the $29,000 level.
The first major support is near the $28,850 level. The main support sits near the $28,500 level. A clear move below the $28,500 support zone may perhaps start a major decline. In the stated case, the price could dive to $27,800.
Technical indicators:
Hourly MACD – The MACD is now slowly losing pace in the bearish zone.
Hourly RSI (Relative Strength Index) – The RSI for BTC/USD is now below the 50 level.
Major Support Levels – $28,850, followed by $28,500.
Major Resistance Levels – $29,650, $30,000 and $30,600.
Tags: bitcoinbtcusdBTCUSDTxbtusd
FeedzyRead More
Crypto analyst Blade has pointed to a Bitcoin trend that could signal when the leading…
Bitcoin and software equities have sharply diverged after moving in lockstep for years, raising questions…
Bitcoin and ether fell Monday after dropping in May, a month that usually sees them…
U.S. spot bitcoin ETFs lost $2.97 billion across 10 trading days through Friday, the longest…
Bitcoin price started a fresh decline below the $73,800 zone. BTC is consolidating and might…
The creator of the Mayer Multiple argues bitcoin’s growing economic substance is compressing volatility and…