Bitcoin started an upside correction above $19,000 against the US Dollar. BTC is now facing a strong resistance near the $19,350 and $19,500 levels.
Bitcoin is attempting an upside correction above the $19,000 level.
The price is still trading below $19,500 and the 100 hourly simple moving average.
There is a major bearish trend line forming with resistance near $19,420 on the hourly chart of the BTC/USD pair (data feed from Kraken).
The pair must clear the trend line and the 100 hourly SMA to continue higher towards $20,500.
Bitcoin Price Faces Hurdles
Bitcoin price started a short-term upside correction from the $18,223 low. BTC was able to climb above the $18,800 and $19,000 levels. It even cleared the $19,350 resistance zone.
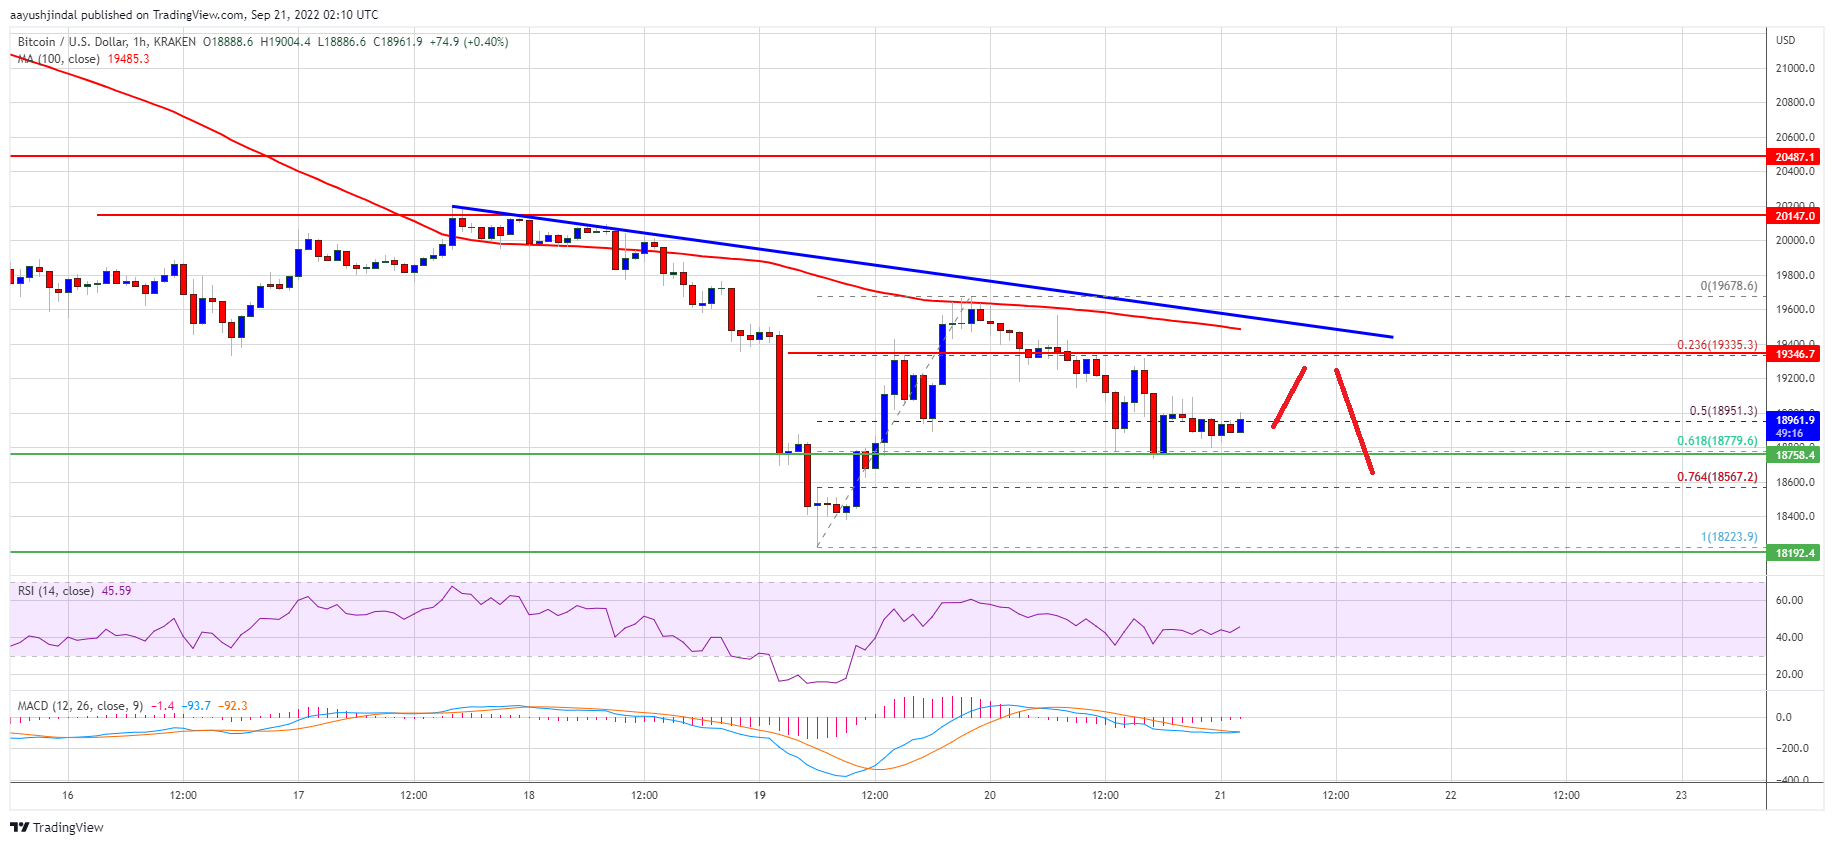
However, the price faced a strong resistance near the $19,650 level and the 100 hourly simple moving average. A high was formed near $19,678 and the price started a fresh decline. There was a move below the $19,500 and $19,400 levels.
Bitcoin price traded below the 50% Fib retracement level of the upward move from the $18,223 swing low to $19,678 high. The bulls are now protecting the $18,800 support zone.
The 61.8% Fib retracement level of the upward move from the $18,223 swing low to $19,678 high is acting as a support. On the upside, an immediate resistance is near the $19,200 level. The next major resistance sits near the $19,350 level.
Source: BTCUSD on TradingView.com
There is also a major bearish trend line forming with resistance near $19,420 on the hourly chart of the BTC/USD pair. A clear move above the trend line, the 100 hourly simple moving average, and $19,500 could open the doors for a move towards the $20,000 level. Any more gains might send the price towards the $20,500 resistance zone.
Fresh Decline in BTC?
If bitcoin fails to continue higher above the $19,350 resistance zone, it could start a fresh decline. An immediate support on the downside is near the $18,800 zone.
The next major support is near the $18,550 level. A clear move below the $18,550 zone could set the pace for a larger decline. In the stated case, the price may even decline below the $18,223 swing low.
Technical indicators:
Hourly MACD – The MACD is now losing pace in the bullish zone.
Hourly RSI (Relative Strength Index) – The RSI for BTC/USD is now near the 50 level.
Major Support Levels – $18,800, followed by $18,550.
Major Resistance Levels – $19,200, $19,350 and $19,500.
Bitcoin started an upside correction above $19,000 against the US Dollar. BTC is now facing a strong resistance near the $19,350 and $19,500 levels.
Bitcoin is attempting an upside correction above the $19,000 level.
The price is still trading below $19,500 and the 100 hourly simple moving average.
There is a major bearish trend line forming with resistance near $19,420 on the hourly chart of the BTC/USD pair (data feed from Kraken).
The pair must clear the trend line and the 100 hourly SMA to continue higher towards $20,500.
Bitcoin price started a short-term upside correction from the $18,223 low. BTC was able to climb above the $18,800 and $19,000 levels. It even cleared the $19,350 resistance zone.
However, the price faced a strong resistance near the $19,650 level and the 100 hourly simple moving average. A high was formed near $19,678 and the price started a fresh decline. There was a move below the $19,500 and $19,400 levels.
Bitcoin price traded below the 50% Fib retracement level of the upward move from the $18,223 swing low to $19,678 high. The bulls are now protecting the $18,800 support zone.
The 61.8% Fib retracement level of the upward move from the $18,223 swing low to $19,678 high is acting as a support. On the upside, an immediate resistance is near the $19,200 level. The next major resistance sits near the $19,350 level.
Source: BTCUSD on TradingView.com
There is also a major bearish trend line forming with resistance near $19,420 on the hourly chart of the BTC/USD pair. A clear move above the trend line, the 100 hourly simple moving average, and $19,500 could open the doors for a move towards the $20,000 level. Any more gains might send the price towards the $20,500 resistance zone.
If bitcoin fails to continue higher above the $19,350 resistance zone, it could start a fresh decline. An immediate support on the downside is near the $18,800 zone.
The next major support is near the $18,550 level. A clear move below the $18,550 zone could set the pace for a larger decline. In the stated case, the price may even decline below the $18,223 swing low.
Technical indicators:
Hourly MACD – The MACD is now losing pace in the bullish zone.
Hourly RSI (Relative Strength Index) – The RSI for BTC/USD is now near the 50 level.
Major Support Levels – $18,800, followed by $18,550.
Major Resistance Levels – $19,200, $19,350 and $19,500.
Tags: bitcoinbtcusdBTCUSDTxbtusd
NewsBTCRead More
Crypto pundit Ash Crypto has drawn attention to speculations about how institutions could be crashing…
Dogecoin and Shiba Inu led losses among major tokens as heavy volume and liquidations overwhelmed…
Bitcoin (BTC) extended its decline on Friday, sliding to levels not seen since early February,…
Bitcoin’s June correction is now being accompanied by a sharp rise in whale deposits to…
Several headwinds converged over bitcoin recently as its largest buyer turned seller, ETF investors headed…
Grayscale’s head of research says Strategy’s leveraged business model has come under pressure, and that…