Bitcoin extended increase above the $44,000 level against the US Dollar. BTC is correcting losses, but it might find support near the $42,000 support zone.
Bitcoin climbed further higher above $44,000 before it faced sellers.
The price is trading near $42,750 and the 100 hourly simple moving average.
There was a break below a key bullish trend line with support near $43,250 on the hourly chart of the BTC/USD pair (data feed from Kraken).
The pair is correcting gains, but dips could be limited below the $42,000 level.
Bitcoin Price Corrects Gains
Bitcoin price extended increase above the $43,200 resistance zone. BTC even spiked above the $44,000 level on two occasions before the bears took a stand.
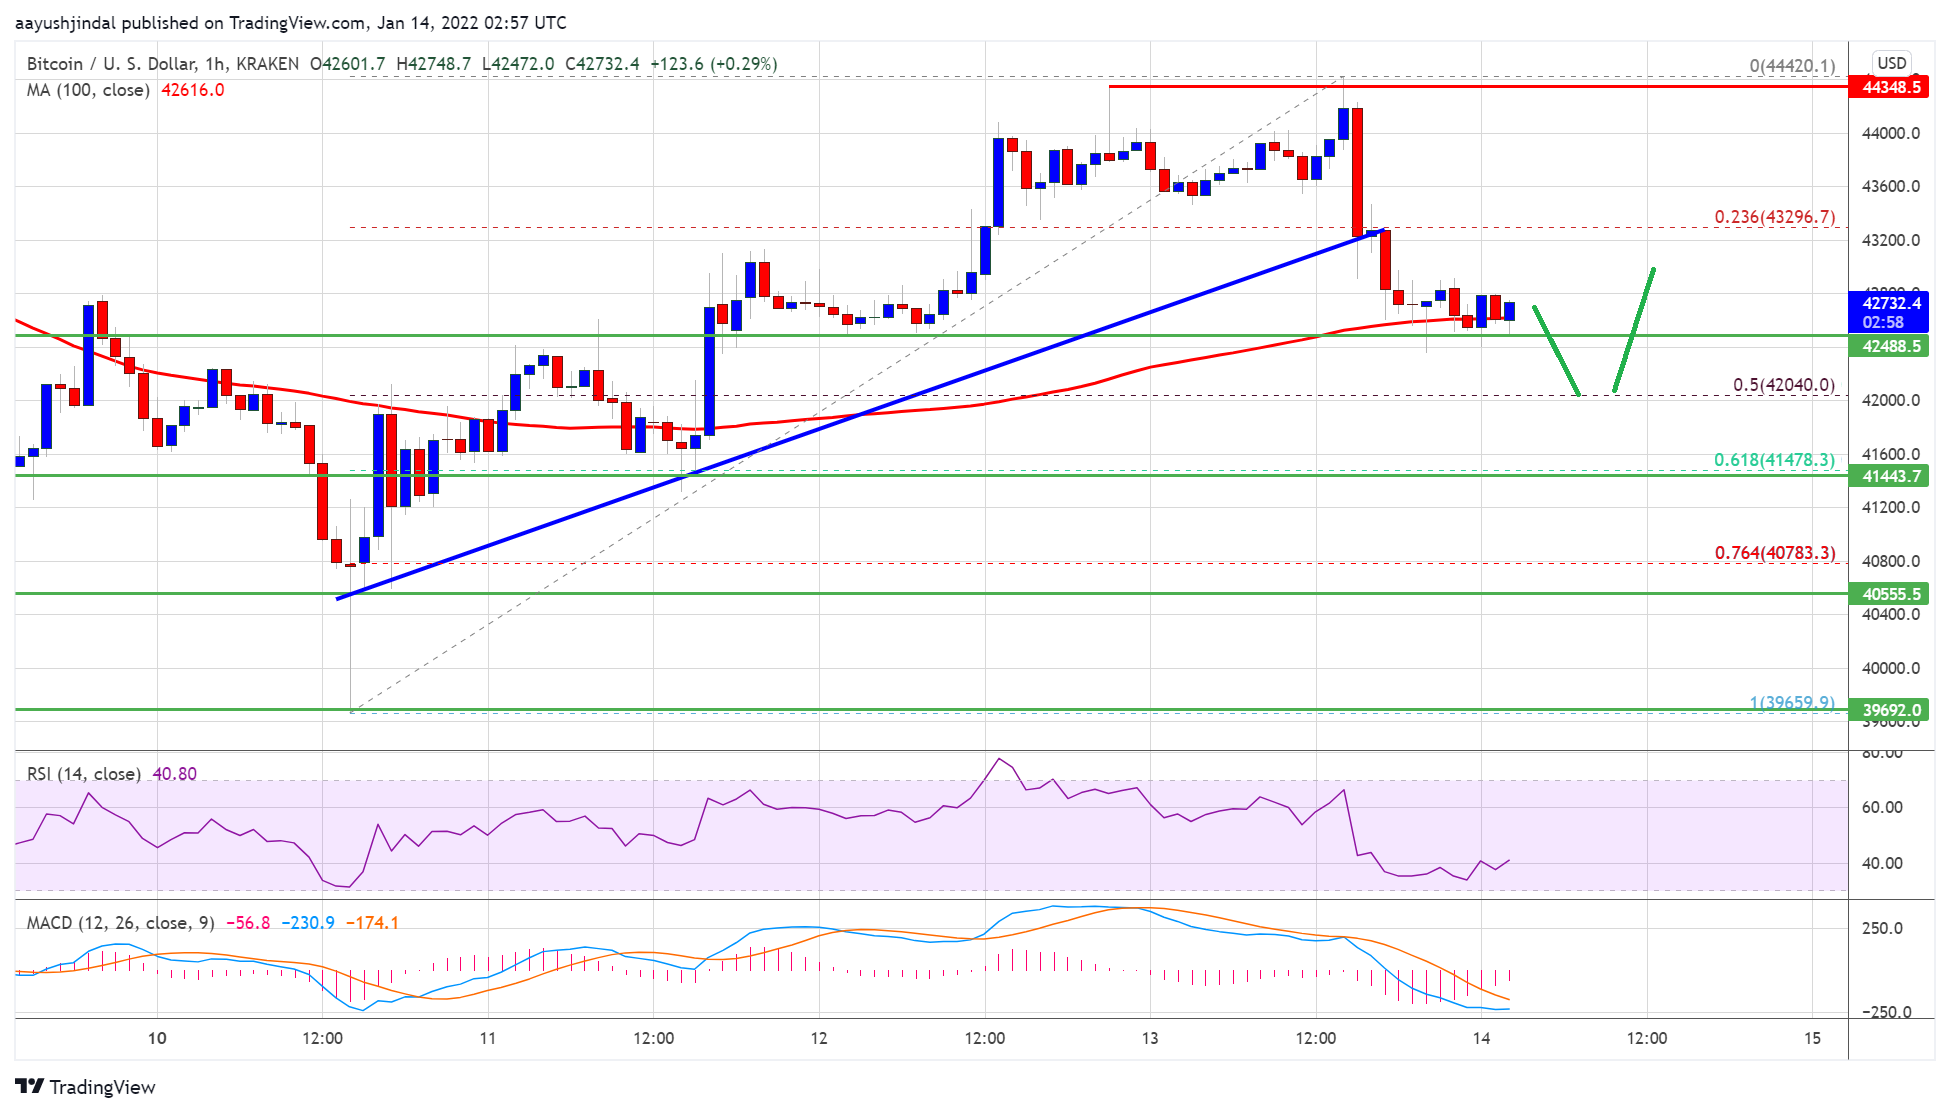
A high was formed near $44,420 and the price is now correcting lower. There was a move below the 23.6% Fib retracement level of the key increase from the $39,660 swing low to $44,420 high. Besides, there was a break below a key bullish trend line with support near $43,250 on the hourly chart of the BTC/USD pair.
Bitcoin price is now trading near $42,750 and the 100 hourly simple moving average. On the upside, an initial resistance is near the $43,000 level.
Source: BTCUSD on TradingView.com
The next major resistance is near the $43,200 level. A clear move above the $43,200 level might send the price towards the $44,000 resistance. Any more gains may perhaps call for a test of the $44,400 resistance zone. The next major resistance is near the $45,500 level, where the bears might appear.
More Losses in BTC?
If bitcoin fails to start a fresh increase above $43,200, it could continue to move down. An immediate support on the downside is near the $42,500 zone. The first major support is seen near the $42,000 zone.
The 50% Fib retracement level of the key increase from the $39,660 swing low to $44,420 high is also near the $42,000 level. A downside break below the $42,000 support zone could lead the price towards the $41,500 level. Any more losses might push the price towards the $40,500 support zone in the coming sessions.
Technical indicators:
Hourly MACD – The MACD is slowly losing pace in the bearish zone.
Hourly RSI (Relative Strength Index) – The RSI for BTC/USD is now below the 50 level.
Major Support Levels – $42,500, followed by $42,000.
Major Resistance Levels – $43,200, $44,000 and $44,400.
Bitcoin extended increase above the $44,000 level against the US Dollar. BTC is correcting losses, but it might find support near the $42,000 support zone.
Bitcoin climbed further higher above $44,000 before it faced sellers.
The price is trading near $42,750 and the 100 hourly simple moving average.
There was a break below a key bullish trend line with support near $43,250 on the hourly chart of the BTC/USD pair (data feed from Kraken).
The pair is correcting gains, but dips could be limited below the $42,000 level.
Bitcoin price extended increase above the $43,200 resistance zone. BTC even spiked above the $44,000 level on two occasions before the bears took a stand.
A high was formed near $44,420 and the price is now correcting lower. There was a move below the 23.6% Fib retracement level of the key increase from the $39,660 swing low to $44,420 high. Besides, there was a break below a key bullish trend line with support near $43,250 on the hourly chart of the BTC/USD pair.
Bitcoin price is now trading near $42,750 and the 100 hourly simple moving average. On the upside, an initial resistance is near the $43,000 level.
Source: BTCUSD on TradingView.com
The next major resistance is near the $43,200 level. A clear move above the $43,200 level might send the price towards the $44,000 resistance. Any more gains may perhaps call for a test of the $44,400 resistance zone. The next major resistance is near the $45,500 level, where the bears might appear.
If bitcoin fails to start a fresh increase above $43,200, it could continue to move down. An immediate support on the downside is near the $42,500 zone. The first major support is seen near the $42,000 zone.
The 50% Fib retracement level of the key increase from the $39,660 swing low to $44,420 high is also near the $42,000 level. A downside break below the $42,000 support zone could lead the price towards the $41,500 level. Any more losses might push the price towards the $40,500 support zone in the coming sessions.
Technical indicators:
Hourly MACD – The MACD is slowly losing pace in the bearish zone.
Hourly RSI (Relative Strength Index) – The RSI for BTC/USD is now below the 50 level.
Major Support Levels – $42,500, followed by $42,000.
Major Resistance Levels – $43,200, $44,000 and $44,400.
Tags: bitcoinbtcusdBTCUSDTxbtusd
FeedzyRead More
A brutal crypto selloff erased $2.6 billion in leveraged bets, sent bitcoin to $60,000 and…
Your day-ahead look for Feb. 6, 2026Read MoreCoinDesk: Bitcoin, Ethereum, Crypto News and Price Data[#item_full_content]
Earnings disappointments weigh on AI related tech, while crypto sentiment improves on bitcoin’s rebound.Read MoreCoinDesk:…
Bitcoin’s role in big-money talks has shifted in recent weeks. Reports say analysts at JPMorgan…
What to Know: Metaplanet’s aggressive Bitcoin accumulation strategy confirms a growing trend of corporate treasury…
Bitcoin is on course to see five red months in a row, as it is…