Bitcoin is showing a few bearish signs below the $24,000 resistance zone against the US Dollar. BTC is declining and might test the $22,000 support zone.
Bitcoin is slowly moving lower below the $24,000 pivot level.
The price is now trading below the $23,500 level and the 100 hourly simple moving average.
There is a key bearish trend line forming with resistance near $23,300 on the hourly chart of the BTC/USD pair (data feed from Kraken).
The pair could continue to move down towards the $22,000 support in the near term.
Bitcoin Price Starts Decrease
Bitcoin price failed to start a fresh increase above the $24,000 resistance zone. The price started a fresh decline and settled below the $23,500 support zone.
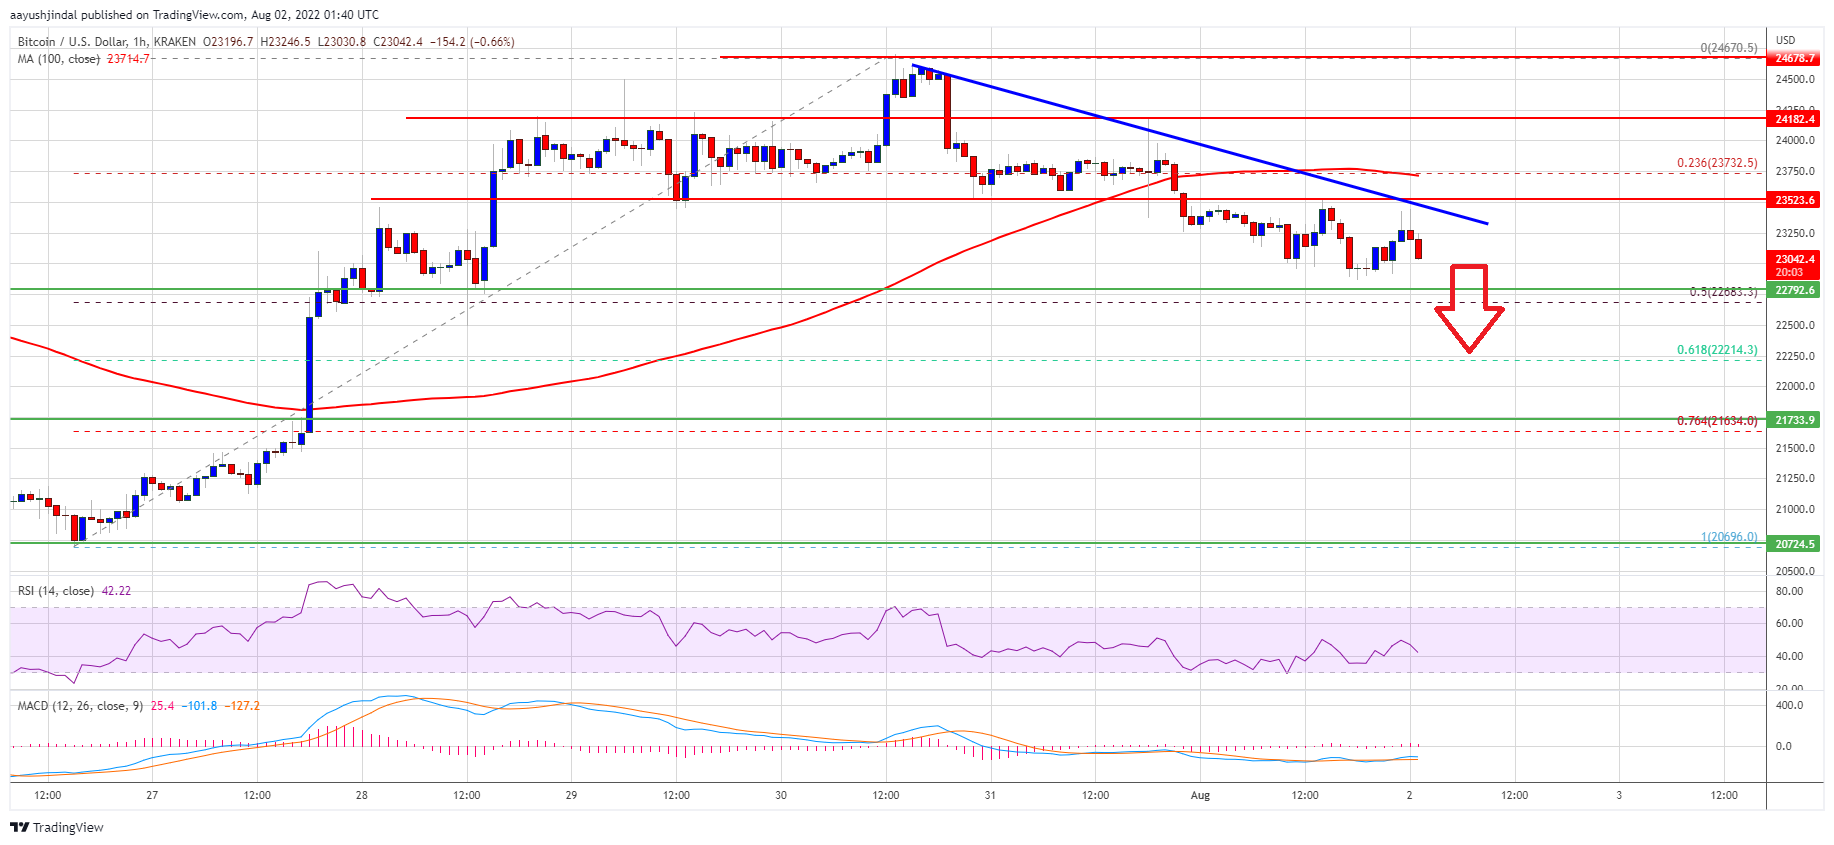
There was a clear move below the 23.6% Fib retracement level of the upward move from the $20,695 swing low to $24,670 high. The price is now showing bearish signs below the $23,500 level and the 100 hourly simple moving average.
There is also a key bearish trend line forming with resistance near $23,300 on the hourly chart of the BTC/USD pair. The current price action suggests bitcoin could continue to move down, with an immediate support at $22,800.
On the upside, the price is facing resistance near the $23,300 level and the trend line. The next key resistance is near the $23,750 zone and the 100 hourly simple moving average.
Source: BTCUSD on TradingView.com
The main resistance could be near the $24,000 zone. A close above the $24,000 resistance zone could set the pace for a fresh increase. In the stated case, the price may perhaps rise towards the $24,500 level. The next major resistance sits near the $25,000 level.
More Losses in BTC?
If bitcoin fails to clear the $23,300 resistance zone, it could continue to move down. An immediate support on the downside is near the $22,800 level.
The next major support now sits near the $22,680 level. It is near the 50% Fib retracement level of the upward move from the $20,695 swing low to $24,670 high. Any more losses might send the price towards $22,000 level.
Technical indicators:
Hourly MACD – The MACD is now gaining pace in the bearish zone.
Hourly RSI (Relative Strength Index) – The RSI for BTC/USD is now below the 50 level.
Major Support Levels – $22,680, followed by $22,000.
Major Resistance Levels – $23,300, $23,750 and $24,000.
Bitcoin is showing a few bearish signs below the $24,000 resistance zone against the US Dollar. BTC is declining and might test the $22,000 support zone.
Bitcoin is slowly moving lower below the $24,000 pivot level.
The price is now trading below the $23,500 level and the 100 hourly simple moving average.
There is a key bearish trend line forming with resistance near $23,300 on the hourly chart of the BTC/USD pair (data feed from Kraken).
The pair could continue to move down towards the $22,000 support in the near term.
Bitcoin price failed to start a fresh increase above the $24,000 resistance zone. The price started a fresh decline and settled below the $23,500 support zone.
There was a clear move below the 23.6% Fib retracement level of the upward move from the $20,695 swing low to $24,670 high. The price is now showing bearish signs below the $23,500 level and the 100 hourly simple moving average.
There is also a key bearish trend line forming with resistance near $23,300 on the hourly chart of the BTC/USD pair. The current price action suggests bitcoin could continue to move down, with an immediate support at $22,800.
On the upside, the price is facing resistance near the $23,300 level and the trend line. The next key resistance is near the $23,750 zone and the 100 hourly simple moving average.
Source: BTCUSD on TradingView.com
The main resistance could be near the $24,000 zone. A close above the $24,000 resistance zone could set the pace for a fresh increase. In the stated case, the price may perhaps rise towards the $24,500 level. The next major resistance sits near the $25,000 level.
If bitcoin fails to clear the $23,300 resistance zone, it could continue to move down. An immediate support on the downside is near the $22,800 level.
The next major support now sits near the $22,680 level. It is near the 50% Fib retracement level of the upward move from the $20,695 swing low to $24,670 high. Any more losses might send the price towards $22,000 level.
Technical indicators:
Hourly MACD – The MACD is now gaining pace in the bearish zone.
Hourly RSI (Relative Strength Index) – The RSI for BTC/USD is now below the 50 level.
Major Support Levels – $22,680, followed by $22,000.
Major Resistance Levels – $23,300, $23,750 and $24,000.
Tags: bitcoinbtcusdBTCUSDTxbtusd
NewsBTCRead More
A key price level is giving Bitcoin trouble — and on-chain data may explain why.…
Strategy, formerly MicroStrategy, has crossed the 760,000 Bitcoin threshold with its latest purchase, bringing its…
Fed chair Jerome Powell said rising energy prices are feeding into the inflation outlook, but…
Bitcoin is starting to show intriguing signals on the monthly time frame, with long-term data…
Bitcoin Magazine Bitcoin Price Fights For $70,000 As Federal Reserve Holds Rates The Federal Reserve…
Bitcoin Magazine Till Death or Seed Phrase: Woman Accused of Spying on Husband, Stealing $172…