Bitcoin is moving higher and trading above the $20,000 zone against the US Dollar. BTC could surge if there is a clear move above $20,580 and $20,730.
Bitcoin is showing a few positive signs above the $20,000 support zone.
The price is now trading above the $20,000 level and the 100 hourly simple moving average.
There is a major bullish trend line forming with support near $19,800 on the hourly chart of the BTC/USD pair (data feed from Kraken).
The pair could start a strong upward move if there is a close above the $20,580 level.
Bitcoin Price Aims Fresh Increase
Bitcoin price stayed well above the $19,500 support zone. BTC formed a low near the $19,750 level and started another increase above the $20,000 resistance zone.
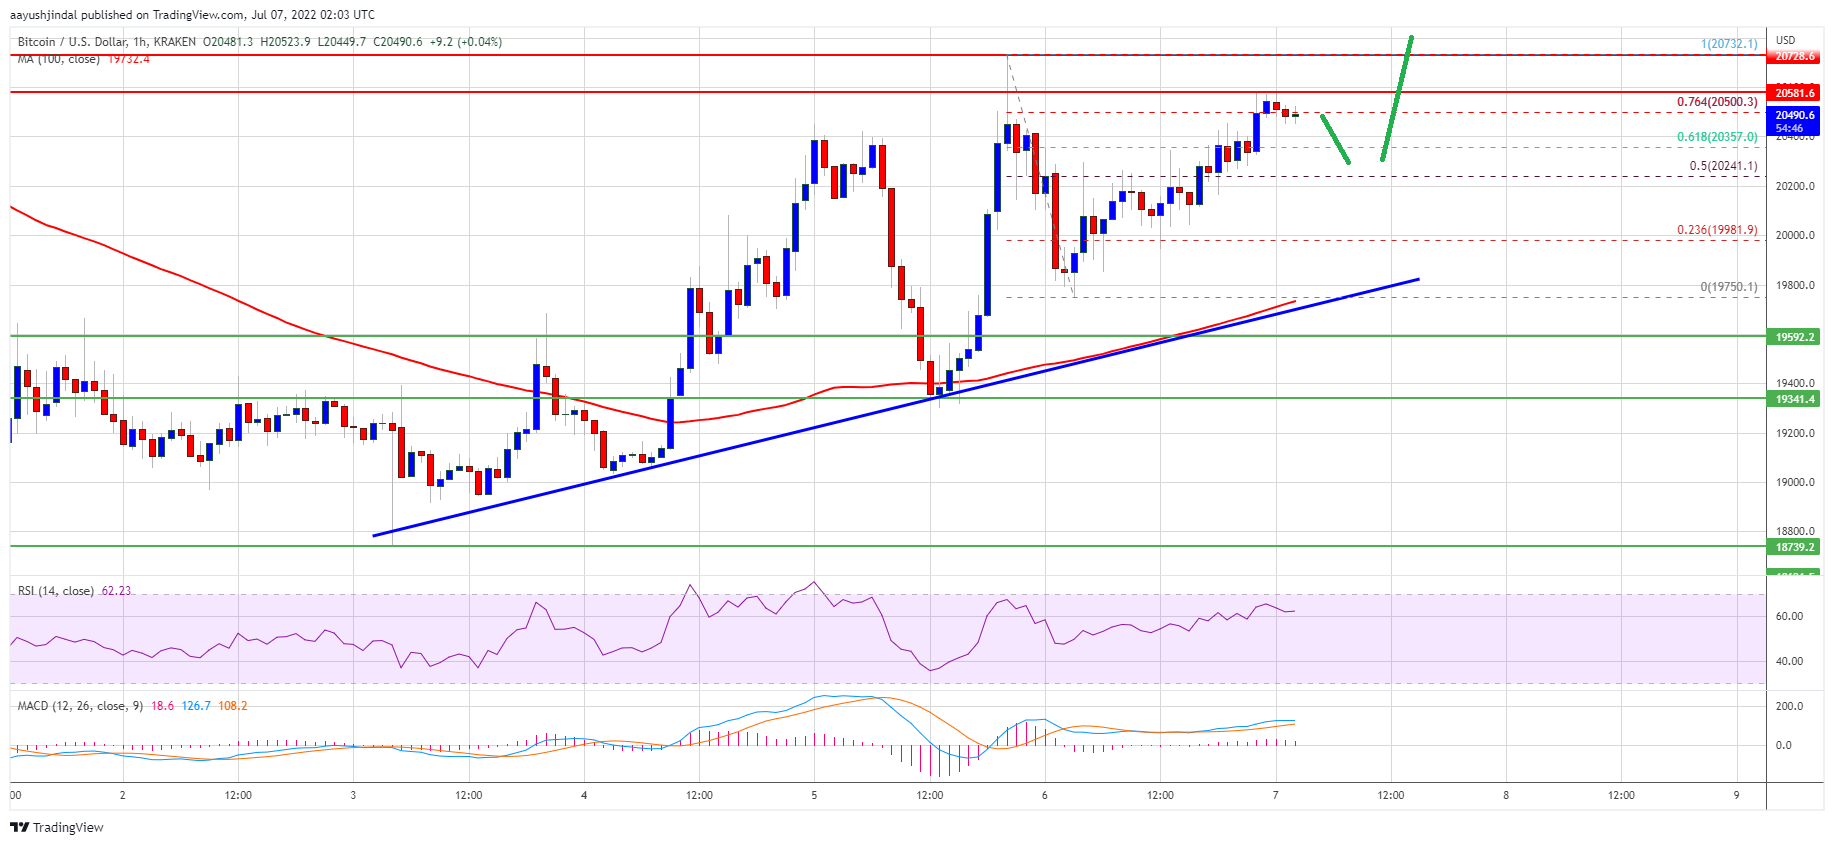
There was a steady move and the price climbed above the 50% Fib retracement level of the downward move from the $20,732 swing high to $19,750 low. The price is now trading above the $20,000 level and the 100 hourly simple moving average.
There is also a major bullish trend line forming with support near $19,800 on the hourly chart of the BTC/USD pair. Bitcoin price is now trading comfortably near the $20,500 zone and the 76.4% Fib retracement level of the downward move from the $20,732 swing high to $19,750 low.
Source: BTCUSD on TradingView.com
On the upside, the price is facing resistance near the $20,550 and $20,580 levels. The next key resistance is near the $20,730 zone. A close above the $20,730 resistance zone could open the doors for a strong increase. In the stated case, the price could rise towards the $21,500 level. The next major resistance sits near the $22,200 level.
Fresh Decline in BTC?
If bitcoin fails to clear the $20,730 resistance zone, it could start a downside correction. An immediate support on the downside is near the $20,200 level.
The next major support now sits near the $19,800 level or the trend line zone. A close below the $19,800 support zone could push the price to $19,500. In the stated case, there is a risk of a move towards the $18,750 level.
Technical indicators:
Hourly MACD – The MACD is now gaining pace in the bullish zone.
Hourly RSI (Relative Strength Index) – The RSI for BTC/USD is now above the 50 level.
Major Support Levels – $20,200, followed by $19,800.
Major Resistance Levels – $20,580, $20,730 and $21,200.
Bitcoin is moving higher and trading above the $20,000 zone against the US Dollar. BTC could surge if there is a clear move above $20,580 and $20,730.
Bitcoin is showing a few positive signs above the $20,000 support zone.
The price is now trading above the $20,000 level and the 100 hourly simple moving average.
There is a major bullish trend line forming with support near $19,800 on the hourly chart of the BTC/USD pair (data feed from Kraken).
The pair could start a strong upward move if there is a close above the $20,580 level.
Bitcoin price stayed well above the $19,500 support zone. BTC formed a low near the $19,750 level and started another increase above the $20,000 resistance zone.
There was a steady move and the price climbed above the 50% Fib retracement level of the downward move from the $20,732 swing high to $19,750 low. The price is now trading above the $20,000 level and the 100 hourly simple moving average.
There is also a major bullish trend line forming with support near $19,800 on the hourly chart of the BTC/USD pair. Bitcoin price is now trading comfortably near the $20,500 zone and the 76.4% Fib retracement level of the downward move from the $20,732 swing high to $19,750 low.
Source: BTCUSD on TradingView.com
On the upside, the price is facing resistance near the $20,550 and $20,580 levels. The next key resistance is near the $20,730 zone. A close above the $20,730 resistance zone could open the doors for a strong increase. In the stated case, the price could rise towards the $21,500 level. The next major resistance sits near the $22,200 level.
If bitcoin fails to clear the $20,730 resistance zone, it could start a downside correction. An immediate support on the downside is near the $20,200 level.
The next major support now sits near the $19,800 level or the trend line zone. A close below the $19,800 support zone could push the price to $19,500. In the stated case, there is a risk of a move towards the $18,750 level.
Technical indicators:
Hourly MACD – The MACD is now gaining pace in the bullish zone.
Hourly RSI (Relative Strength Index) – The RSI for BTC/USD is now above the 50 level.
Major Support Levels – $20,200, followed by $19,800.
Major Resistance Levels – $20,580, $20,730 and $21,200.
Tags: bitcoinbtcusdBTCUSDTxbtusd
FeedzyRead More
A potential US military strike on Iran’s main oil export terminal helped push Bitcoin to…
Bitcoin Magazine Bitcoin Price Surges Above $75,000 as Bullish Momentum Builds The bitcoin price climbed…
The alleged theft of 2,323 bitcoin has triggered a High Court dispute testing how English…
Bitcoin Magazine Bitcoin at Key Support Levels — Why Jack Mallers Says Turn On DCA…
Data shows the Bitcoin Fear & Greed Index has marked an improvement after the latest…
Bitcoin Magazine Eric Trump Confirmed As Speaker For Bitcoin 2026 Conference Bitcoin Magazine has confirmed…