Bitcoin gained pace and even spiked above the $22,000 resistance against the US Dollar. BTC is correcting gains, but dips might be limited below $21,500.
Bitcoin was able to clear the $21,200 and $21,500 resistance levels.
The price is now trading above $21,500 and the 100 hourly simple moving average.
There is a key bullish trend lien forming with support near $21,600 on the hourly chart of the BTC/USD pair (data feed from Kraken).
The pair is correcting gains, but dips might be limited below the $21,500 level.
Bitcoin Price Starts Fresh Rally
Bitcoin price remained well bid above the $20,000 level and started a fresh increase. There was a clear move above the $21,000 and $21,200 resistance levels.
The price even surpassed the $21,500 resistance and spiked above the $22,000 resistance. A high was formed near $22,347 and the price recently started a downside correction. There was a move below the $22,000 and $21,850 levels.
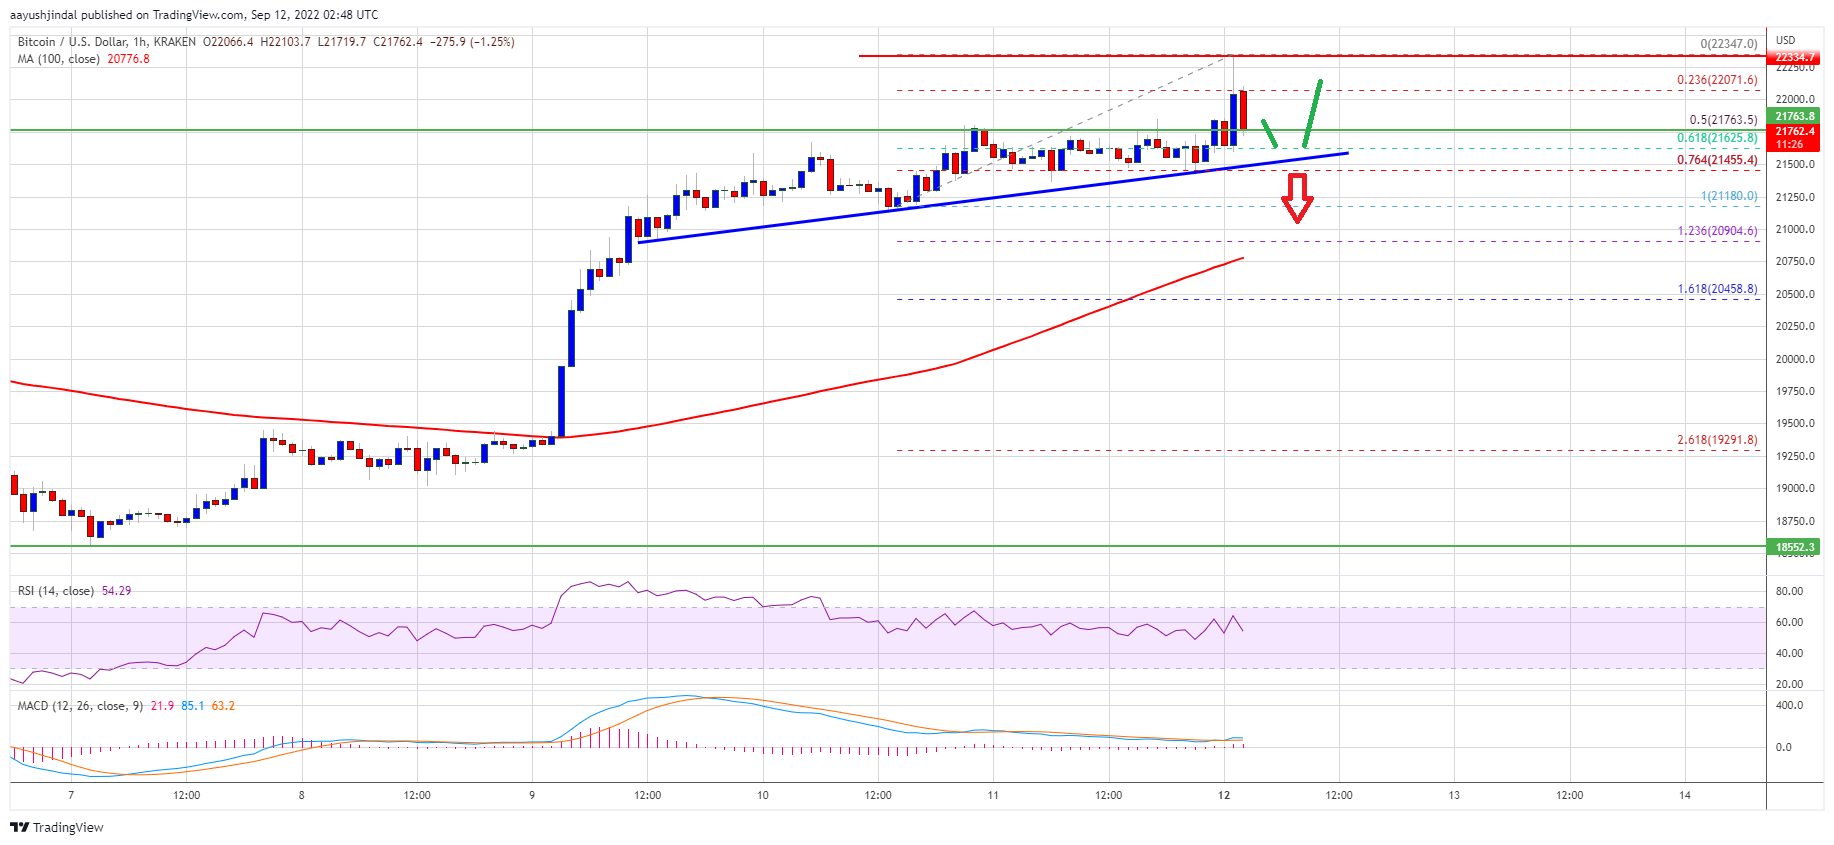
Bitcoin price traded below the 23.6% Fib retracement level of the recent increase from the $21,180 swing low to $22,347 high. It is now trading above $21,500 and the 100 hourly simple moving average. Besides, there is a key bullish trend lien forming with support near $21,600 on the hourly chart of the BTC/USD pair.
Source: BTCUSD on TradingView.com
On the upside, an immediate resistance is near the $22,000 level. The next major resistance sits near the $22,350 level. A clear move above the $22,350 resistance might start another steady increase. In the stated case, the price may perhaps rise towards $22,800. Any more gains might send the price towards the $23,200 resistance zone.
Dips Limited in BTC?
If bitcoin fails to gain pace above the $22,000 zone, it could start a downside correction. An immediate support on the downside is near the $21,700 zone.
The 50% Fib retracement level of the recent increase from the $21,180 swing low to $22,347 high is also near $21,700. The first major support is now forming near the $21,600 level. A downside break below the $21,600 level might send the price towards the $21,200 support.
Technical indicators:
Hourly MACD – The MACD is now gaining pace in the bearish zone.
Hourly RSI (Relative Strength Index) – The RSI for BTC/USD is now above the 50 level.
Major Support Levels – $21,700, followed by $21,600.
Major Resistance Levels – $22,000, $22,350 and $23,200.
Bitcoin gained pace and even spiked above the $22,000 resistance against the US Dollar. BTC is correcting gains, but dips might be limited below $21,500.
Bitcoin was able to clear the $21,200 and $21,500 resistance levels.
The price is now trading above $21,500 and the 100 hourly simple moving average.
There is a key bullish trend lien forming with support near $21,600 on the hourly chart of the BTC/USD pair (data feed from Kraken).
The pair is correcting gains, but dips might be limited below the $21,500 level.
Bitcoin price remained well bid above the $20,000 level and started a fresh increase. There was a clear move above the $21,000 and $21,200 resistance levels.
The price even surpassed the $21,500 resistance and spiked above the $22,000 resistance. A high was formed near $22,347 and the price recently started a downside correction. There was a move below the $22,000 and $21,850 levels.
Bitcoin price traded below the 23.6% Fib retracement level of the recent increase from the $21,180 swing low to $22,347 high. It is now trading above $21,500 and the 100 hourly simple moving average. Besides, there is a key bullish trend lien forming with support near $21,600 on the hourly chart of the BTC/USD pair.
Source: BTCUSD on TradingView.com
On the upside, an immediate resistance is near the $22,000 level. The next major resistance sits near the $22,350 level. A clear move above the $22,350 resistance might start another steady increase. In the stated case, the price may perhaps rise towards $22,800. Any more gains might send the price towards the $23,200 resistance zone.
If bitcoin fails to gain pace above the $22,000 zone, it could start a downside correction. An immediate support on the downside is near the $21,700 zone.
The 50% Fib retracement level of the recent increase from the $21,180 swing low to $22,347 high is also near $21,700. The first major support is now forming near the $21,600 level. A downside break below the $21,600 level might send the price towards the $21,200 support.
Technical indicators:
Hourly MACD – The MACD is now gaining pace in the bearish zone.
Hourly RSI (Relative Strength Index) – The RSI for BTC/USD is now above the 50 level.
Major Support Levels – $21,700, followed by $21,600.
Major Resistance Levels – $22,000, $22,350 and $23,200.
Tags: bitcoinbtcusdBTCUSDTxbtusd
NewsBTCRead More
Despite stabilizing spot prices, investors remain defensive, with leveraged speculation cooling and realized volatility dropping…
Crypto analyst Ardi has pointed to a bear market divergence to explain what has been…
Bitcoin is hovering near the $71,000 mark, consolidating after recent swings as the market digests…
First-quarter purchases have reached 89,618 BTC so far, the most since fourth-quarter 2024, and the…
Bitcoin (BTC) is showing early signs of a prolonged decline after peaking in October 2025.…
According to a recent on-chain data evaluation, the Bitcoin price might not be seeing a…