Bitcoin spiked below the key $28,500 support zone against the US Dollar. BTC is declining and might continue to move down towards the $27,500 support.
Bitcoin is moving lower and facing a major resistance near the $29,600 zone.
The price is now trading below the $29,000 level and the 100 hourly simple moving average.
There is a major bearish trend line forming with resistance near $29,600 on the hourly chart of the BTC/USD pair (data feed from Kraken).
The pair could continue to move down if it settles below the $28,500 support.
Bitcoin Price Faces Selling Pressure
Bitcoin price remained below the key $30,000 resistance zone. BTC started a fresh decline and there was a sharp move below the $28,500 support zone.
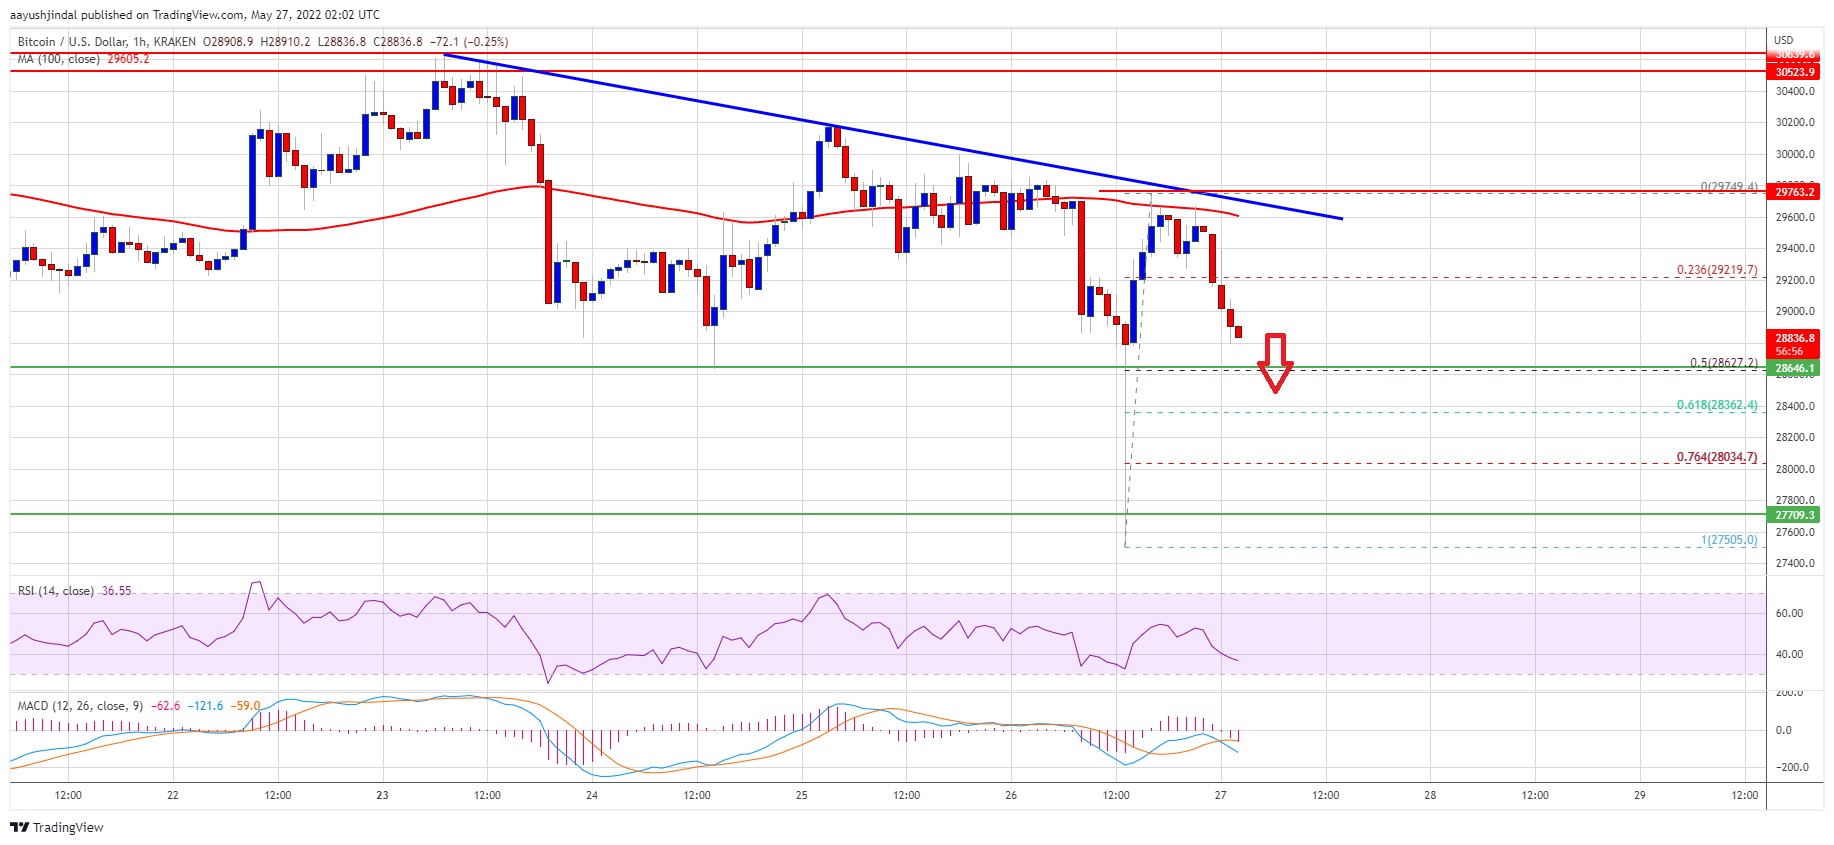
The bears pushed the price below the $28,000 level. The price even tested the $27,500 support and a low is formed near $27,505. However, there was a strong recovery and the price climbed above $28,500. The bulls pushed the price above $29,000, but they struggled near $29,600.
There is also a major bearish trend line forming with resistance near $29,600 on the hourly chart of the BTC/USD pair. Bitcoin traded below the 23.6% Fib retracement level of the upward move from the $27,505 swing low to $29,749 high.
It is now trading below the $29,000 level and the 100 hourly simple moving average. An immediate resistance on the upside is near the $29,250 level. The next major resistance is near the $29,600 level and the 100 hourly simple moving average.
Source: BTCUSD on TradingView.com
The main resistance sits near the $29,750. It is near the 50% Fib retracement level of the upward move from the $27,505 swing low to $29,749 high. A clear move above the $29,750 resistance level might start a strong increase. In the stated case, the price may perhaps rise towards the $30,600 resistance zone.
More Losses in BTC?
If bitcoin fails to clear the $29,600 resistance zone, it could continue to move down. An immediate support on the downside is near the $28,650 level.
The first major support is near the $28,500 level. A downside break below the $28,500 support might send the price further lower. In the stated case, the price may perhaps revisit the $27,500 support zone.
Technical indicators:
Hourly MACD – The MACD is now gaining pace in the bearish zone.
Hourly RSI (Relative Strength Index) – The RSI for BTC/USD is now below the 50 level.
Major Support Levels – $28,500, followed by $27,500.
Major Resistance Levels – $29,600, $29,750 and $30,600.
Bitcoin spiked below the key $28,500 support zone against the US Dollar. BTC is declining and might continue to move down towards the $27,500 support.
Bitcoin is moving lower and facing a major resistance near the $29,600 zone.
The price is now trading below the $29,000 level and the 100 hourly simple moving average.
There is a major bearish trend line forming with resistance near $29,600 on the hourly chart of the BTC/USD pair (data feed from Kraken).
The pair could continue to move down if it settles below the $28,500 support.
Bitcoin price remained below the key $30,000 resistance zone. BTC started a fresh decline and there was a sharp move below the $28,500 support zone.
The bears pushed the price below the $28,000 level. The price even tested the $27,500 support and a low is formed near $27,505. However, there was a strong recovery and the price climbed above $28,500. The bulls pushed the price above $29,000, but they struggled near $29,600.
There is also a major bearish trend line forming with resistance near $29,600 on the hourly chart of the BTC/USD pair. Bitcoin traded below the 23.6% Fib retracement level of the upward move from the $27,505 swing low to $29,749 high.
It is now trading below the $29,000 level and the 100 hourly simple moving average. An immediate resistance on the upside is near the $29,250 level. The next major resistance is near the $29,600 level and the 100 hourly simple moving average.
Source: BTCUSD on TradingView.com
The main resistance sits near the $29,750. It is near the 50% Fib retracement level of the upward move from the $27,505 swing low to $29,749 high. A clear move above the $29,750 resistance level might start a strong increase. In the stated case, the price may perhaps rise towards the $30,600 resistance zone.
If bitcoin fails to clear the $29,600 resistance zone, it could continue to move down. An immediate support on the downside is near the $28,650 level.
The first major support is near the $28,500 level. A downside break below the $28,500 support might send the price further lower. In the stated case, the price may perhaps revisit the $27,500 support zone.
Technical indicators:
Hourly MACD – The MACD is now gaining pace in the bearish zone.
Hourly RSI (Relative Strength Index) – The RSI for BTC/USD is now below the 50 level.
Major Support Levels – $28,500, followed by $27,500.
Major Resistance Levels – $29,600, $29,750 and $30,600.
Tags: bitcoinbtcusdBTCUSDTxbtusd
FeedzyRead More
U.S. spot bitcoin ETFs lost $2.97 billion across 10 trading days through Friday, the longest…
Bitcoin price started a fresh decline below the $73,800 zone. BTC is consolidating and might…
The creator of the Mayer Multiple argues bitcoin’s growing economic substance is compressing volatility and…
Prominent crypto analysis page XWIN Research Japan reports that Bitcoin has reached a new milestone:…
Bitcoin’s market cap has dropped to roughly $1.46 trillion, pushing it below several major technology…
Bitcoin’s return to $100,000 is still a popular target across the market for 2026, but…