Bitcoin started a fresh decline from the $32,400 resistance against the US Dollar. BTC must stay above the $29,450 to avoid more downsides.
Bitcoin started a fresh decline after it failed to clear the $32,400 resistance zone.
The price is now trading below the $30,000 level and the 100 hourly simple moving average.
There was a break below a key bullish trend line with support near $31,750 on the hourly chart of the BTC/USD pair (data feed from Kraken).
The pair could extend its decline if it breaks the $29,450 and $29,400 support levels.
Bitcoin Price Trims Gains
Bitcoin price started another decline from the $32,400 resistance zone. There was a steady decline below the $32,000 and $31,500 levels.
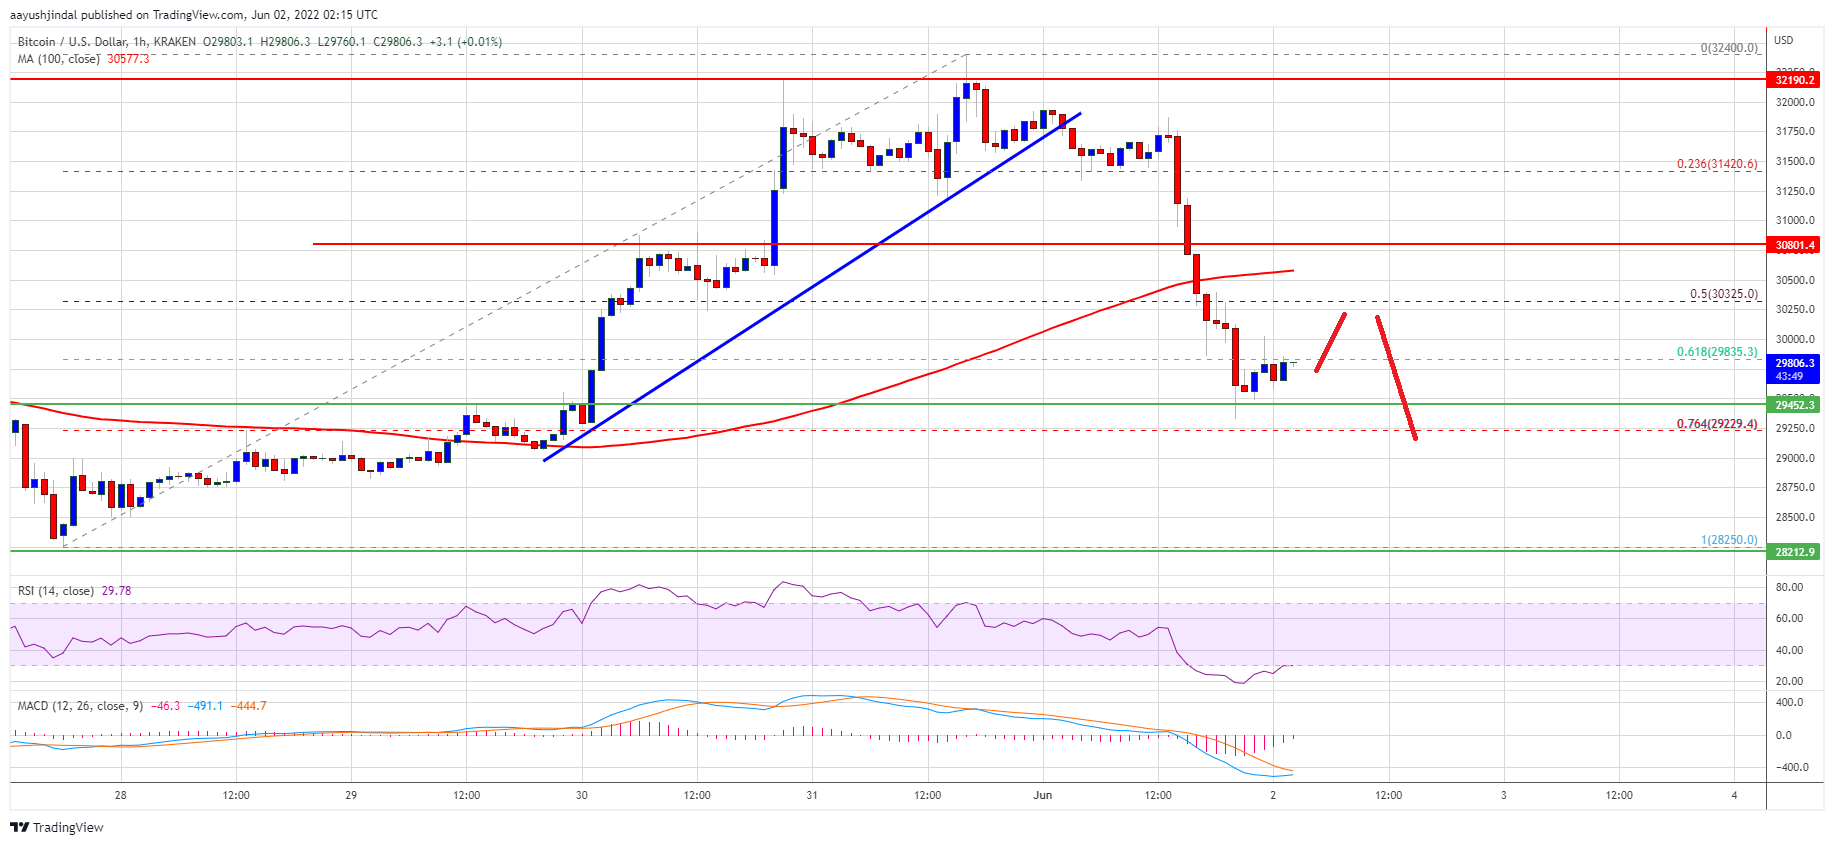
More importantly, there was a break below a key bullish trend line with support near $31,750 on the hourly chart of the BTC/USD pair. The pair traded below the 50% Fib retracement level of the upward move from the $28,250 swing low to $32,400 high.
Bitcoin price is now trading below the $30,000 level and the 100 hourly simple moving average. The price is also consolidating near the 61.8% Fib retracement level of the upward move from the $28,250 swing low to $32,400 high.
An immediate resistance on the upside is near the $30,000 level. The next major resistance is near the $30,400 and the 100 hourly simple moving average.
Source: BTCUSD on TradingView.com
A clear move above the $30,400 resistance level could start another increase. In the stated case, the price could rise towards the $30,800 resistance. The next major resistance sits near the $32,000 level.
More Losses in BTC?
If bitcoin fails to clear the $30,400 resistance zone, it could continue to move down. An immediate support on the downside is near the $29,450 level.
The next major support is near the $29,250 level. A downside break below the $29,250 support may perhaps put a lot of pressure on the bulls. In the stated case, the price could revisit the $28,250 support zone. Any more losses might send the price towards the $27,500 level.
Technical indicators:
Hourly MACD – The MACD is now losing pace in the bearish zone.
Hourly RSI (Relative Strength Index) – The RSI for BTC/USD is correcting higher above the 30 level.
Major Support Levels – $29,450, followed by $28,250.
Major Resistance Levels – $30,000, $30,400 and $30,800.
Bitcoin started a fresh decline from the $32,400 resistance against the US Dollar. BTC must stay above the $29,450 to avoid more downsides.
Bitcoin started a fresh decline after it failed to clear the $32,400 resistance zone.
The price is now trading below the $30,000 level and the 100 hourly simple moving average.
There was a break below a key bullish trend line with support near $31,750 on the hourly chart of the BTC/USD pair (data feed from Kraken).
The pair could extend its decline if it breaks the $29,450 and $29,400 support levels.
Bitcoin price started another decline from the $32,400 resistance zone. There was a steady decline below the $32,000 and $31,500 levels.
More importantly, there was a break below a key bullish trend line with support near $31,750 on the hourly chart of the BTC/USD pair. The pair traded below the 50% Fib retracement level of the upward move from the $28,250 swing low to $32,400 high.
Bitcoin price is now trading below the $30,000 level and the 100 hourly simple moving average. The price is also consolidating near the 61.8% Fib retracement level of the upward move from the $28,250 swing low to $32,400 high.
An immediate resistance on the upside is near the $30,000 level. The next major resistance is near the $30,400 and the 100 hourly simple moving average.
Source: BTCUSD on TradingView.com
A clear move above the $30,400 resistance level could start another increase. In the stated case, the price could rise towards the $30,800 resistance. The next major resistance sits near the $32,000 level.
If bitcoin fails to clear the $30,400 resistance zone, it could continue to move down. An immediate support on the downside is near the $29,450 level.
The next major support is near the $29,250 level. A downside break below the $29,250 support may perhaps put a lot of pressure on the bulls. In the stated case, the price could revisit the $28,250 support zone. Any more losses might send the price towards the $27,500 level.
Technical indicators:
Hourly MACD – The MACD is now losing pace in the bearish zone.
Hourly RSI (Relative Strength Index) – The RSI for BTC/USD is correcting higher above the 30 level.
Major Support Levels – $29,450, followed by $28,250.
Major Resistance Levels – $30,000, $30,400 and $30,800.
Tags: bitcoinbtcusdBTCUSDTxbtusd
FeedzyRead More
Bitcoin (BTC) made a notable recovery on Friday, witnessing a 4% surge that led the…
More than $246 million in crypto futures positions were wiped out in a single day…
The largest cryptocurrency is up 4.2% on the week despite Friday's reversal, with attention now…
Lekker Capital CIO Quinn Thompson argues on X that collapsing mining economics, combined with a…
A Cambridge study spanning 11 years and 68 verified cable failures found that Bitcoin's physical…
On-chain analytics firm Glassnode has explained how a flip in Bitcoin short-term holder profitability could…