Bitcoin found a strong buying interest near $18,500 against the US Dollar. BTC is recovering and there could be a fresh increase above the $20,000 resistance.
Bitcoin remained stable and the bulls again protected the $18,500 support zone.
The price is trading above $19,000 and the 100 hourly simple moving average.
There is a short-term channel forming with support near $19,280 on the hourly chart of the BTC/USD pair (data feed from Kraken).
The pair could start a fresh rally if there is a clear move above the $19,650 resistance zone.
Bitcoin Price Holds Key Support
Bitcoin price declined heavily from well above the $20,000 pivot level. BTC dropped below the $19,000 level, but the bulls were active near the $18,500 support zone.
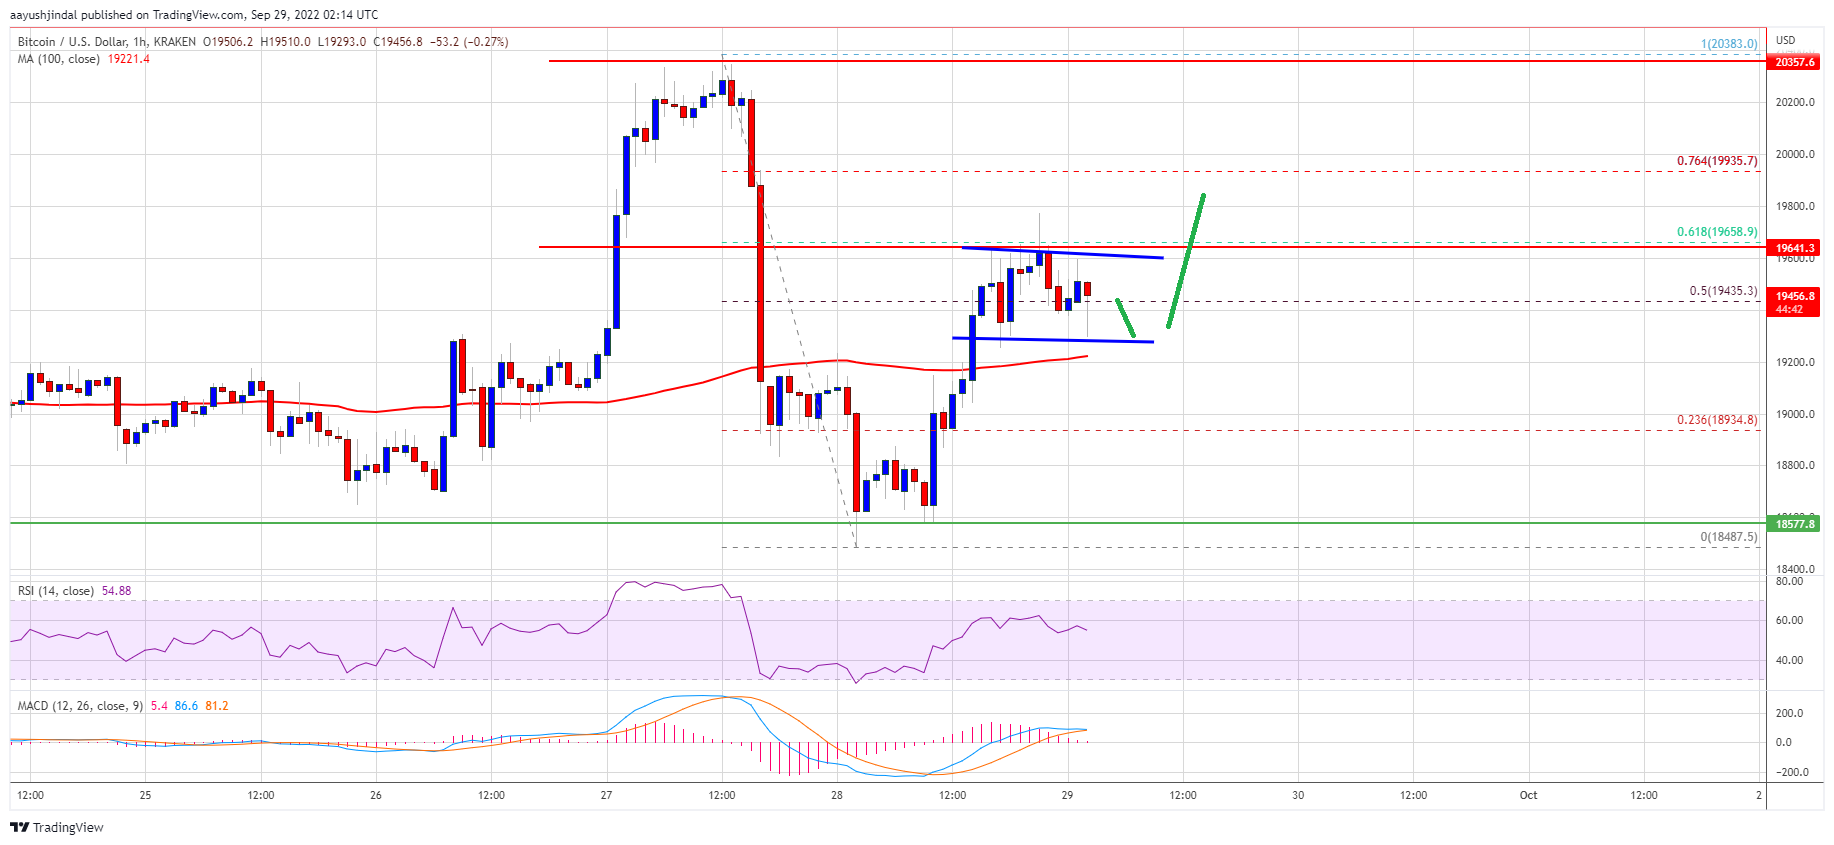
It seems like the price is well supported near the $18,500 zone and there are multiple rejections visible around the same area. The price is now rising and there was a move above the $19,000 resistance zone. The bulls pushed the price above the 50% Fib retracement level of the downward move from the $20,383 swing high to $18,487 low.
Bitcoin price is now trading above $19,000 and the 100 hourly simple moving average. There is also a short-term channel forming with support near $19,280 on the hourly chart of the BTC/USD pair.
On the upside, an immediate resistance is near the $19,600 level. The next major resistance sits near the $19,650 zone. It is close to the 61.8% Fib retracement level of the downward move from the $20,383 swing high to $18,487 low.
Source: BTCUSD on TradingView.com
A close above the $19,650 level might start a fresh increase. In the stated case, the price could rise towards $20,000. Any more gains might lead the price higher towards the $20,500 resistance zone.
Another Decline in BTC?
If bitcoin fails to recover above the $19,650 resistance zone, it could start a fresh decline. An immediate support on the downside is near the $19,280 zone and the channel trend line.
The next major support is near the $19,200 zone and the 100 hourly SMA. The main support is near $19,000. Any more losses might call for a drop towards the $18,500 support zone in the coming sessions.
Technical indicators:
Hourly MACD – The MACD is now losing pace in the bullish zone.
Hourly RSI (Relative Strength Index) – The RSI for BTC/USD is now above the 50 level.
Major Support Levels – $19,200, followed by $19,000.
Major Resistance Levels – $19,650, $20,000 and $20,500.
Bitcoin found a strong buying interest near $18,500 against the US Dollar. BTC is recovering and there could be a fresh increase above the $20,000 resistance.
Bitcoin remained stable and the bulls again protected the $18,500 support zone.
The price is trading above $19,000 and the 100 hourly simple moving average.
There is a short-term channel forming with support near $19,280 on the hourly chart of the BTC/USD pair (data feed from Kraken).
The pair could start a fresh rally if there is a clear move above the $19,650 resistance zone.
Bitcoin price declined heavily from well above the $20,000 pivot level. BTC dropped below the $19,000 level, but the bulls were active near the $18,500 support zone.
It seems like the price is well supported near the $18,500 zone and there are multiple rejections visible around the same area. The price is now rising and there was a move above the $19,000 resistance zone. The bulls pushed the price above the 50% Fib retracement level of the downward move from the $20,383 swing high to $18,487 low.
Bitcoin price is now trading above $19,000 and the 100 hourly simple moving average. There is also a short-term channel forming with support near $19,280 on the hourly chart of the BTC/USD pair.
On the upside, an immediate resistance is near the $19,600 level. The next major resistance sits near the $19,650 zone. It is close to the 61.8% Fib retracement level of the downward move from the $20,383 swing high to $18,487 low.
Source: BTCUSD on TradingView.com
A close above the $19,650 level might start a fresh increase. In the stated case, the price could rise towards $20,000. Any more gains might lead the price higher towards the $20,500 resistance zone.
If bitcoin fails to recover above the $19,650 resistance zone, it could start a fresh decline. An immediate support on the downside is near the $19,280 zone and the channel trend line.
The next major support is near the $19,200 zone and the 100 hourly SMA. The main support is near $19,000. Any more losses might call for a drop towards the $18,500 support zone in the coming sessions.
Technical indicators:
Hourly MACD – The MACD is now losing pace in the bullish zone.
Hourly RSI (Relative Strength Index) – The RSI for BTC/USD is now above the 50 level.
Major Support Levels – $19,200, followed by $19,000.
Major Resistance Levels – $19,650, $20,000 and $20,500.
Tags: bitcoinbtcusdBTCUSDTxbtusd
NewsBTCRead More
Bitcoin Magazine David Bailey Confirmed As A Bitcoin 2026 Speaker David Bailey has been officially…
Bitcoin Magazine Paraguay Adopts Stricter Crypto Oversight, Mandates Detailed Transaction on Bitcoin Reporting Paraguay’s National…
Bitcoin Magazine Policy Group Calls for Bitcoin Inclusion in Proposed Crypto Tax Exemption The Bitcoin…
Bitcoin Magazine Corporate Bitcoin Holdings Hit Record High as Institutions Accumulate 2.8x Mining Supply: Report…
Research shows that only 8% to 10% of global Bitcoin hashrate runs in oil-sensitive power…
Today’s quantum computers are far from breaking Bitcoin’s cryptography and any real threat would likely…