Bitcoin remained in a positive zone above $31,200 against the US Dollar. BTC could correct lower, but the bulls might remain active near $30,800.
Bitcoin is showing positive signs above the $30,500 and $31,000 resistance levels.
The price is now trading above the $31,200 level and the 100 hourly simple moving average.
There is a key bullish trend line forming with support near $31,800 on the hourly chart of the BTC/USD pair (data feed from Kraken).
The pair could correct lower and test the $31,000 and $30,800 support levels.
Bitcoin Price Faces Key Resistance
Bitcoin price extended increase above the $31,000 zone. It even broke the $32,000 resistance on a couple of occasions, but the bears protected more gains above $32,200.
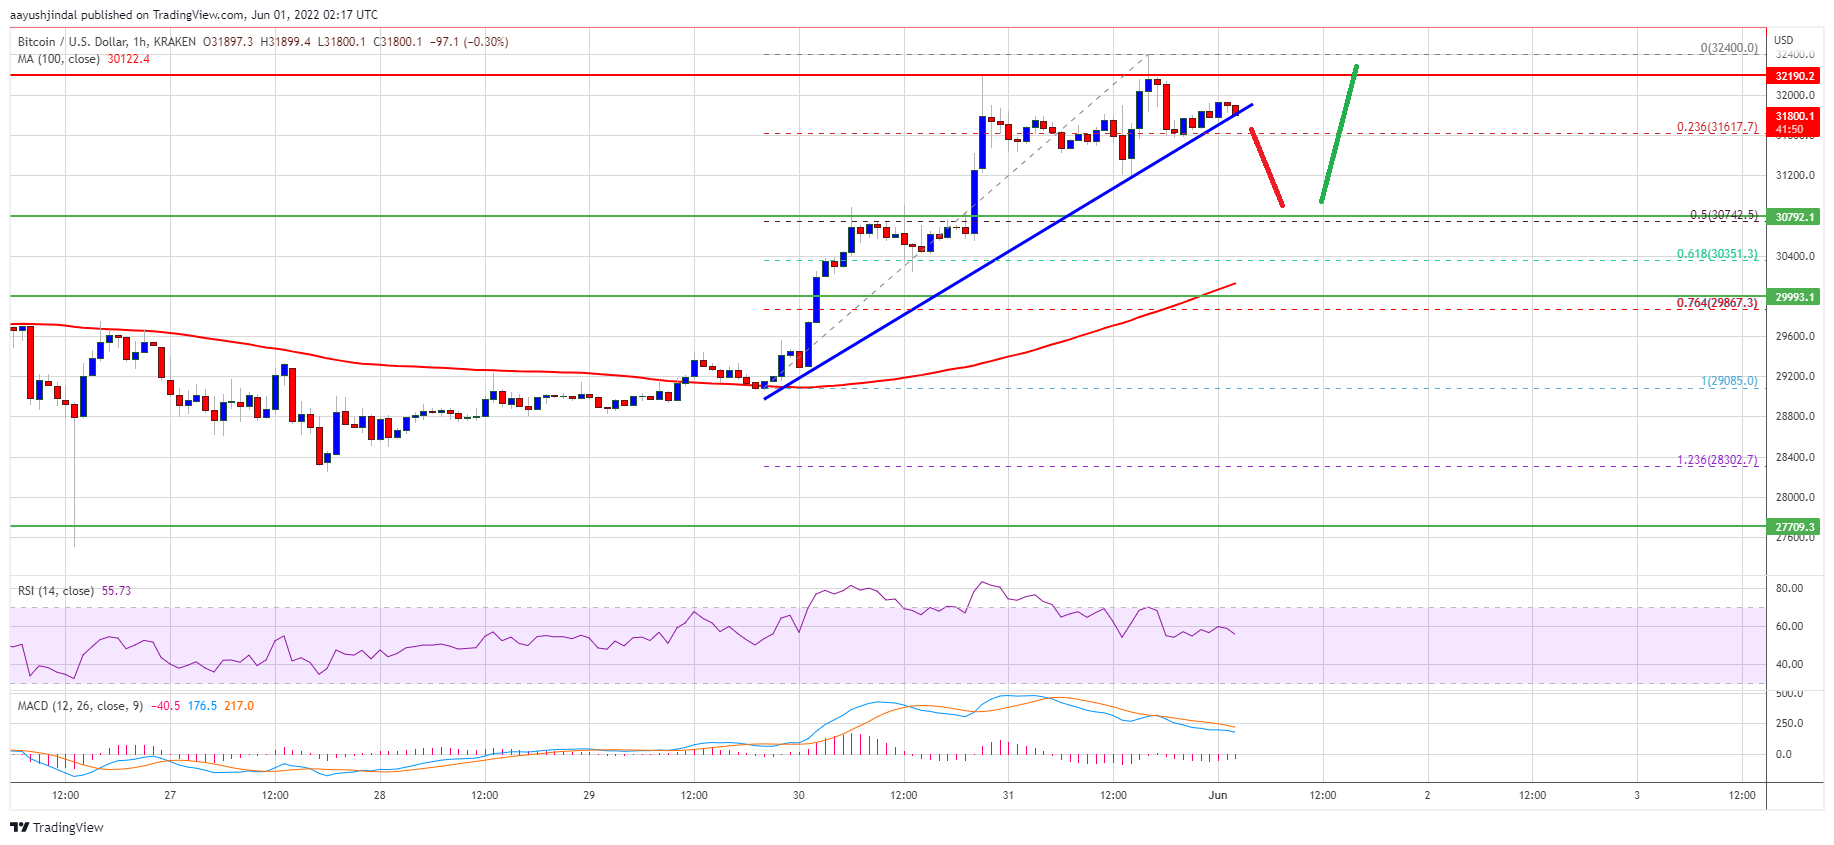
The recent swing high was formed near $32,400 before the price started a downside correction. There was a move below the $32,000 level. The price corrected and tested the 23.6% Fib retracement level of the upward move from the $29,085 swing low to $32,400 high.
It is now testing the $31,800 zone. There is also a key bullish trend line forming with support near $31,800 on the hourly chart of the BTC/USD pair. Bitcoin is also well above the $31,200 level and the 100 hourly simple moving average.
Source: BTCUSD on TradingView.com
An immediate resistance on the upside is near the $32,000 level. The next major resistance is near the $32,200 and $32,400 levels. A clear move above the $32,400 resistance level could start another increase. In the stated case, the price could rise towards the $32,500 resistance. The next major resistance sits near the $33,400 level.
Dips Supported in BTC?
If bitcoin fails to clear the $32,400 resistance zone, it could start a downside correction. An immediate support on the downside is near the $31,800 level and the trend line. A downside break below the trend line could send the price towards the $30,800 support.
The 50% Fib retracement level of the upward move from the $29,085 swing low to $32,400 high is also near the $30,800 level. Any more gains might open the doors for a move towards the $30,000 support.
Technical indicators:
Hourly MACD – The MACD is now losing pace in the bullish zone.
Hourly RSI (Relative Strength Index) – The RSI for BTC/USD is moving lower towards the 50 level.
Major Support Levels – $31,800, followed by $30,800.
Major Resistance Levels – $32,000, $32,200 and $32,400.
Bitcoin remained in a positive zone above $31,200 against the US Dollar. BTC could correct lower, but the bulls might remain active near $30,800.
Bitcoin is showing positive signs above the $30,500 and $31,000 resistance levels.
The price is now trading above the $31,200 level and the 100 hourly simple moving average.
There is a key bullish trend line forming with support near $31,800 on the hourly chart of the BTC/USD pair (data feed from Kraken).
The pair could correct lower and test the $31,000 and $30,800 support levels.
Bitcoin price extended increase above the $31,000 zone. It even broke the $32,000 resistance on a couple of occasions, but the bears protected more gains above $32,200.
The recent swing high was formed near $32,400 before the price started a downside correction. There was a move below the $32,000 level. The price corrected and tested the 23.6% Fib retracement level of the upward move from the $29,085 swing low to $32,400 high.
It is now testing the $31,800 zone. There is also a key bullish trend line forming with support near $31,800 on the hourly chart of the BTC/USD pair. Bitcoin is also well above the $31,200 level and the 100 hourly simple moving average.
Source: BTCUSD on TradingView.com
An immediate resistance on the upside is near the $32,000 level. The next major resistance is near the $32,200 and $32,400 levels. A clear move above the $32,400 resistance level could start another increase. In the stated case, the price could rise towards the $32,500 resistance. The next major resistance sits near the $33,400 level.
If bitcoin fails to clear the $32,400 resistance zone, it could start a downside correction. An immediate support on the downside is near the $31,800 level and the trend line. A downside break below the trend line could send the price towards the $30,800 support.
The 50% Fib retracement level of the upward move from the $29,085 swing low to $32,400 high is also near the $30,800 level. Any more gains might open the doors for a move towards the $30,000 support.
Technical indicators:
Hourly MACD – The MACD is now losing pace in the bullish zone.
Hourly RSI (Relative Strength Index) – The RSI for BTC/USD is moving lower towards the 50 level.
Major Support Levels – $31,800, followed by $30,800.
Major Resistance Levels – $32,000, $32,200 and $32,400.
Tags: bitcoinbtcusdBTCUSDTxbtusd
FeedzyRead More
Hougan says bitcoin could reach that milestone if it captures a larger share of the…
After another failed attempt at breaking the $74,000 resistance, the Bitcoin price continues to hover…
Prominent analyst Darkfost shares that Bitcoin remains a long time away from establishing a new…
Over the last day, Bitcoin prices have remained within the $70,000 – $72,000 region, recording…
Each escalation in the Iran conflict has been larger than the last, but each bitcoin…
The Bitcoin price has not particularly impressed over the past two weeks, but it appears…