Bitcoin started an upside correction above $19,000 against the US Dollar. BTC is now struggling to clear the $19,400 and $19,500 resistance levels.
Bitcoin traded as low as $18,550 and started an upside correction.
The price is now trading below the $19,500 level and the 100 hourly simple moving average.
There is a major bearish trend line forming with resistance near $19,310 on the hourly chart of the BTC/USD pair (data feed from Kraken).
The pair might start another drop unless there is a clear move above the $19,500 resistance.
Bitcoin Price Faces Resistance
Bitcoin price started a major decline below the key $19,500 support zone. BTC gained pace for a move below the $19,000 level and the 100 hourly simple moving average.
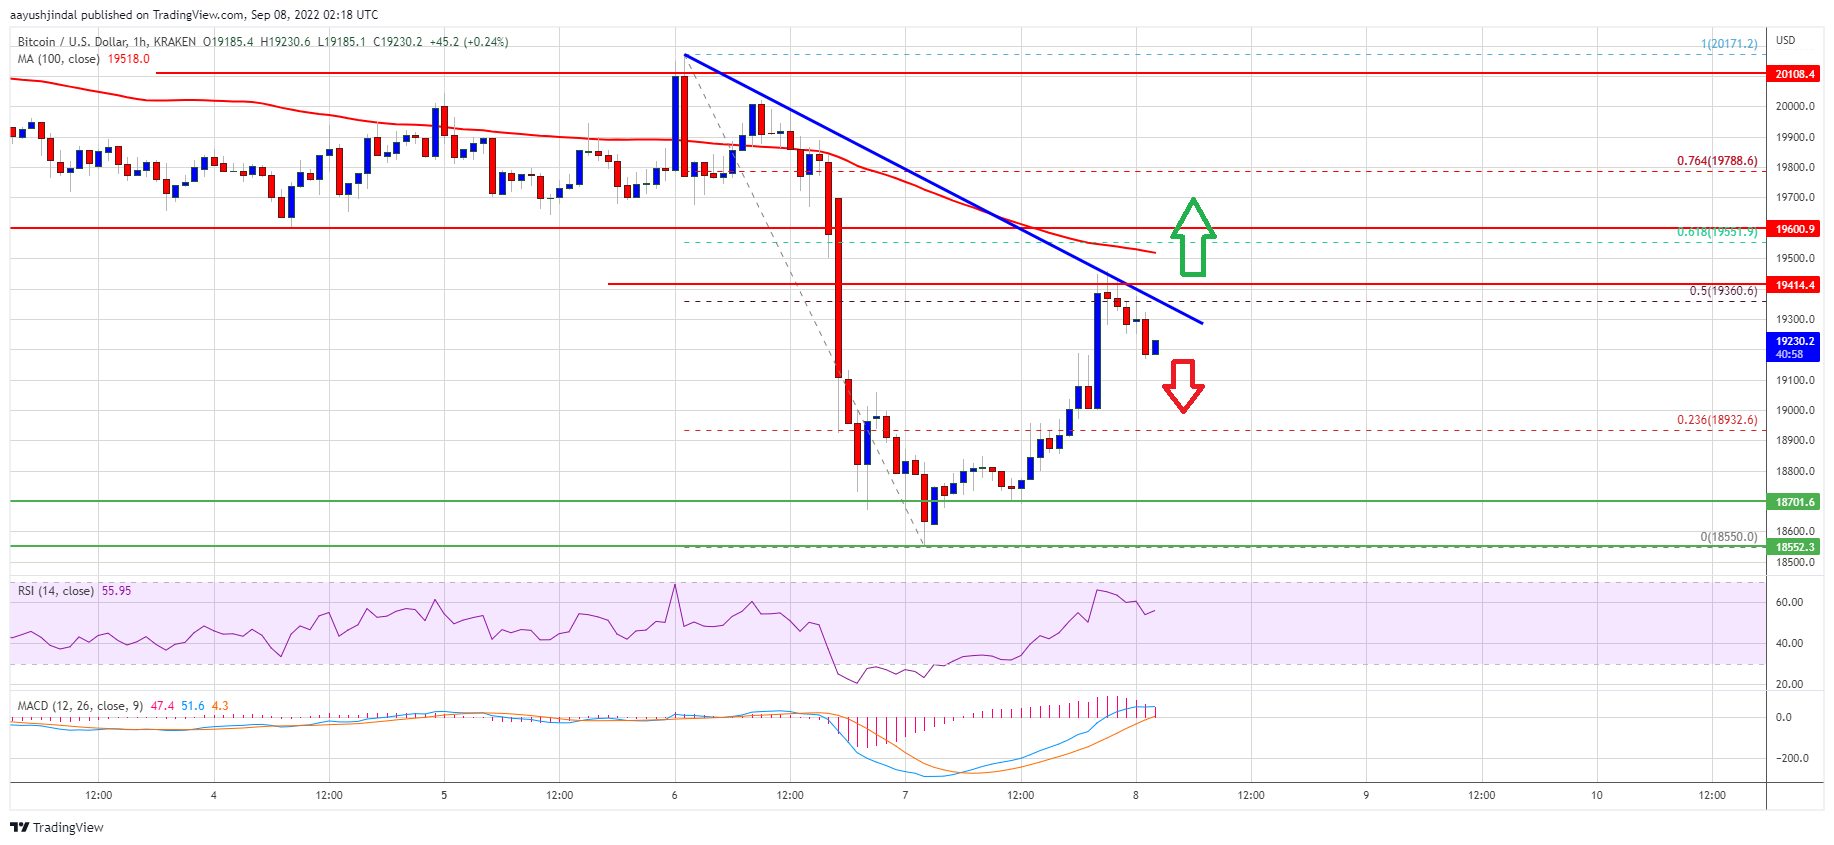
The price even traded below the $19,000 level and tested $18,500. A low was formed near $18,550 and the price recently started an upside correction. There was a move above the $19,000 resistance zone. The bulls pushed the price above the 23.6% Fib retracement level of the key drop from the $20,172 swing high to $18,550 low.
However, the bears remained active near the $19,500 resistance zone. There is also a major bearish trend line forming with resistance near $19,310 on the hourly chart of the BTC/USD pair.
Bitcoin faced rejection near the 50% Fib retracement level of the key drop from the $20,172 swing high to $18,550 low. It is now trading below the $19,500 level and the 100 hourly simple moving average. On the upside, an immediate resistance is near the $19,300 level.
Source: BTCUSD on TradingView.com
The next major resistance sits near the $19,500 level. A clear move above the $19,500 resistance might start a steady increase to $20,000. Any more gains might send the price towards the $20,500 resistance zone.
Fresh Decline in BTC?
If bitcoin fails to start a recovery wave above the $19,500 zone, it could continue to move down. An immediate support on the downside is near the $19,000 zone.
The next major support sits near the $18,550 level. A downside break below the $18,550 support might spark more downsides. In the stated case, the price could drop towards the $18,000 support.
Technical indicators:
Hourly MACD – The MACD is now losing pace in the bullish zone.
Hourly RSI (Relative Strength Index) – The RSI for BTC/USD is now above the 50 level.
Major Support Levels – $19,000, followed by $18,550.
Major Resistance Levels – $19,300, $19,500 and $20,000.
Bitcoin started an upside correction above $19,000 against the US Dollar. BTC is now struggling to clear the $19,400 and $19,500 resistance levels.
Bitcoin traded as low as $18,550 and started an upside correction.
The price is now trading below the $19,500 level and the 100 hourly simple moving average.
There is a major bearish trend line forming with resistance near $19,310 on the hourly chart of the BTC/USD pair (data feed from Kraken).
The pair might start another drop unless there is a clear move above the $19,500 resistance.
Bitcoin price started a major decline below the key $19,500 support zone. BTC gained pace for a move below the $19,000 level and the 100 hourly simple moving average.
The price even traded below the $19,000 level and tested $18,500. A low was formed near $18,550 and the price recently started an upside correction. There was a move above the $19,000 resistance zone. The bulls pushed the price above the 23.6% Fib retracement level of the key drop from the $20,172 swing high to $18,550 low.
However, the bears remained active near the $19,500 resistance zone. There is also a major bearish trend line forming with resistance near $19,310 on the hourly chart of the BTC/USD pair.
Bitcoin faced rejection near the 50% Fib retracement level of the key drop from the $20,172 swing high to $18,550 low. It is now trading below the $19,500 level and the 100 hourly simple moving average. On the upside, an immediate resistance is near the $19,300 level.
Source: BTCUSD on TradingView.com
The next major resistance sits near the $19,500 level. A clear move above the $19,500 resistance might start a steady increase to $20,000. Any more gains might send the price towards the $20,500 resistance zone.
If bitcoin fails to start a recovery wave above the $19,500 zone, it could continue to move down. An immediate support on the downside is near the $19,000 zone.
The next major support sits near the $18,550 level. A downside break below the $18,550 support might spark more downsides. In the stated case, the price could drop towards the $18,000 support.
Technical indicators:
Hourly MACD – The MACD is now losing pace in the bullish zone.
Hourly RSI (Relative Strength Index) – The RSI for BTC/USD is now above the 50 level.
Major Support Levels – $19,000, followed by $18,550.
Major Resistance Levels – $19,300, $19,500 and $20,000.
Tags: bitcoinbtcusdBTCUSDTxbtusd
NewsBTCRead More
Crude oil climbed back above $100 a barrel and Bitcoin slipped as US President Donald…
In the middle of a surge higher following President Trump's overnight comments, the price of…
Bitcoin Magazine Bitcoin Treasuries Are Cracking as Public Companies Turn into BTC Sellers A wave…
Bitcoin Magazine Bitcoin Price Continues Sliding as President Trump Signals Iran Escalation, Raising Risk of…
Long term holder trends suggest a maturing bear market, yet extended consolidation could test investor…
Bitcoin’s recent price structure has not been easy to sit through. The price action has…