Bitcoin extended losses and traded below $19,200 against the US Dollar. BTC found support near $19,000 and started an upside correction.
Bitcoin traded as low as $18,916 and started an upside correction.
The price is now trading above the $20,000 level and testing the 100 hourly simple moving average.
There was a break above a key bearish trend line with resistance near $19,400 on the hourly chart of the BTC/USD pair (data feed from Kraken).
The pair might gain bullish momentum if it clears the 100 hourly SMA and $20,600.
Bitcoin Price Recovers Above $20K
Bitcoin price started a fresh decline below the $20,000 support zone. The price even broke the $19,600 and $19,250 support levels.
Finally, there was a spike below the $19,000 level. A low was formed near $18,916 and the price is now correcting losses. There was a steady move above the $19,250 and $19,500 levels. The bulls pumped the price above the 23.6% Fib retracement level of the downward move from the $22,499 swing high to $18,916 low.
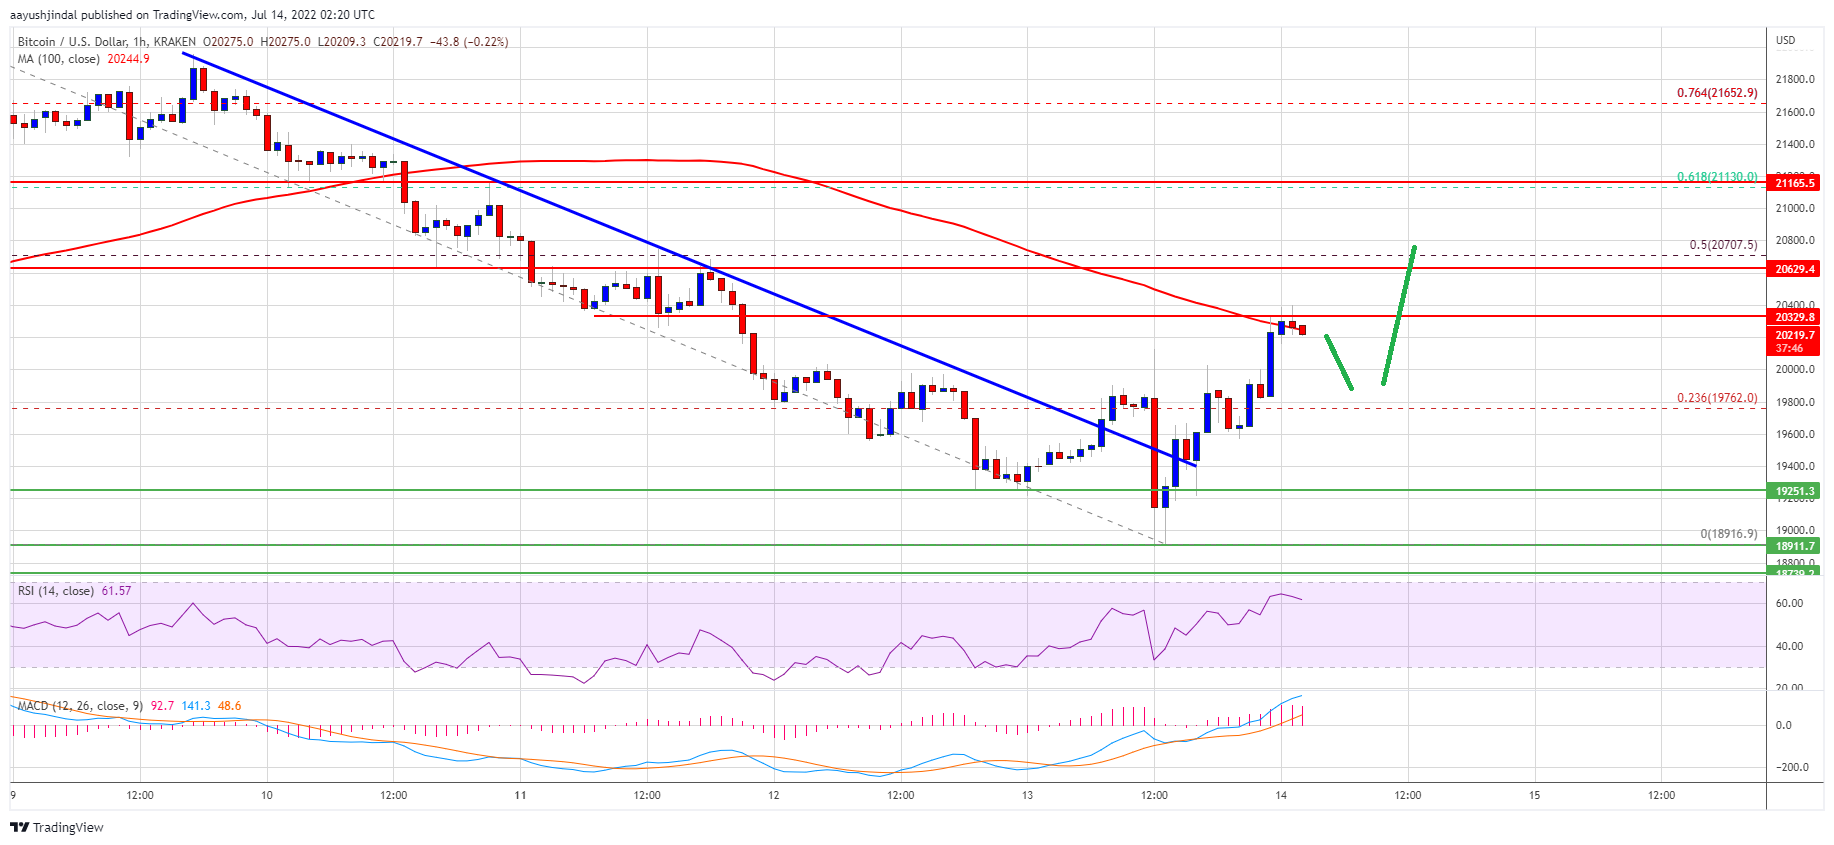
Besides, there was a break above a key bearish trend line with resistance near $19,400 on the hourly chart of the BTC/USD pair. The price even climbed above the $20,000 resistance level.
Bitcoin is now trading above the $20,000 level and testing the 100 hourly simple moving average. It seems to be facing resistance near the $20,350 level. On the upside, the price could resistance near the $20,600 level. The next key resistance is near the $20,700 zone.
The 50% Fib retracement level of the downward move from the $22,499 swing high to $18,916 low is also near the $20,700 level. A close above the $20,700 resistance zone could set the pace for a decent increase.
Source: BTCUSD on TradingView.com
In the stated case, the price may perhaps rise towards the $21,650 level. The next major resistance sits near the $22,000 level.
Fresh Decline in BTC?
If bitcoin fails to start a recovery wave above the $20,600 level, it could start a fresh decline. An immediate support on the downside is near the $20,000 level.
The next major support now sits near the $19,500 level. A close below the $19,500 support zone could accelerate losses. In the stated case, there is a risk of a move towards the $18,800 level.
Technical indicators:
Hourly MACD – The MACD is now gaining pace in the bullish zone.
Hourly RSI (Relative Strength Index) – The RSI for BTC/USD is now above the 50 level.
Major Support Levels – $20,000, followed by $19,500.
Major Resistance Levels – $20,350, $20,600 and $20,700.
Bitcoin extended losses and traded below $19,200 against the US Dollar. BTC found support near $19,000 and started an upside correction.
Bitcoin traded as low as $18,916 and started an upside correction.
The price is now trading above the $20,000 level and testing the 100 hourly simple moving average.
There was a break above a key bearish trend line with resistance near $19,400 on the hourly chart of the BTC/USD pair (data feed from Kraken).
The pair might gain bullish momentum if it clears the 100 hourly SMA and $20,600.
Bitcoin price started a fresh decline below the $20,000 support zone. The price even broke the $19,600 and $19,250 support levels.
Finally, there was a spike below the $19,000 level. A low was formed near $18,916 and the price is now correcting losses. There was a steady move above the $19,250 and $19,500 levels. The bulls pumped the price above the 23.6% Fib retracement level of the downward move from the $22,499 swing high to $18,916 low.
Besides, there was a break above a key bearish trend line with resistance near $19,400 on the hourly chart of the BTC/USD pair. The price even climbed above the $20,000 resistance level.
Bitcoin is now trading above the $20,000 level and testing the 100 hourly simple moving average. It seems to be facing resistance near the $20,350 level. On the upside, the price could resistance near the $20,600 level. The next key resistance is near the $20,700 zone.
The 50% Fib retracement level of the downward move from the $22,499 swing high to $18,916 low is also near the $20,700 level. A close above the $20,700 resistance zone could set the pace for a decent increase.
Source: BTCUSD on TradingView.com
In the stated case, the price may perhaps rise towards the $21,650 level. The next major resistance sits near the $22,000 level.
If bitcoin fails to start a recovery wave above the $20,600 level, it could start a fresh decline. An immediate support on the downside is near the $20,000 level.
The next major support now sits near the $19,500 level. A close below the $19,500 support zone could accelerate losses. In the stated case, there is a risk of a move towards the $18,800 level.
Technical indicators:
Hourly MACD – The MACD is now gaining pace in the bullish zone.
Hourly RSI (Relative Strength Index) – The RSI for BTC/USD is now above the 50 level.
Major Support Levels – $20,000, followed by $19,500.
Major Resistance Levels – $20,350, $20,600 and $20,700.
Tags: bitcoinbtcusdBTCUSDTxbtusd
FeedzyRead More
Your day-ahead look for March 25, 2026Read MoreCoinDesk: Bitcoin, Ethereum, Crypto News and Price Data[#item_full_content]
As gold posts its worst run since 1920, bitcoin gains ground and outperforms, pushing the…
BTC rises with equities while surging open interest and fading volatility point to leveraged positioning…
Bitcoin traders are again staring at a chart structure that resembles the setup that preceded…
Bitcoin options worth billions of dollars will expire on Deribit this Friday at 8:00 UTC.Read…
Iran told the International Maritime Organization this week that non-hostile ships could pass through the…