Bitcoin remained strong above the $28,500 support against the US Dollar. BTC is rising, but it must clear $28,500 to move into a positive zone.
Bitcoin started a fresh increase after it tested the $28,500 support zone.
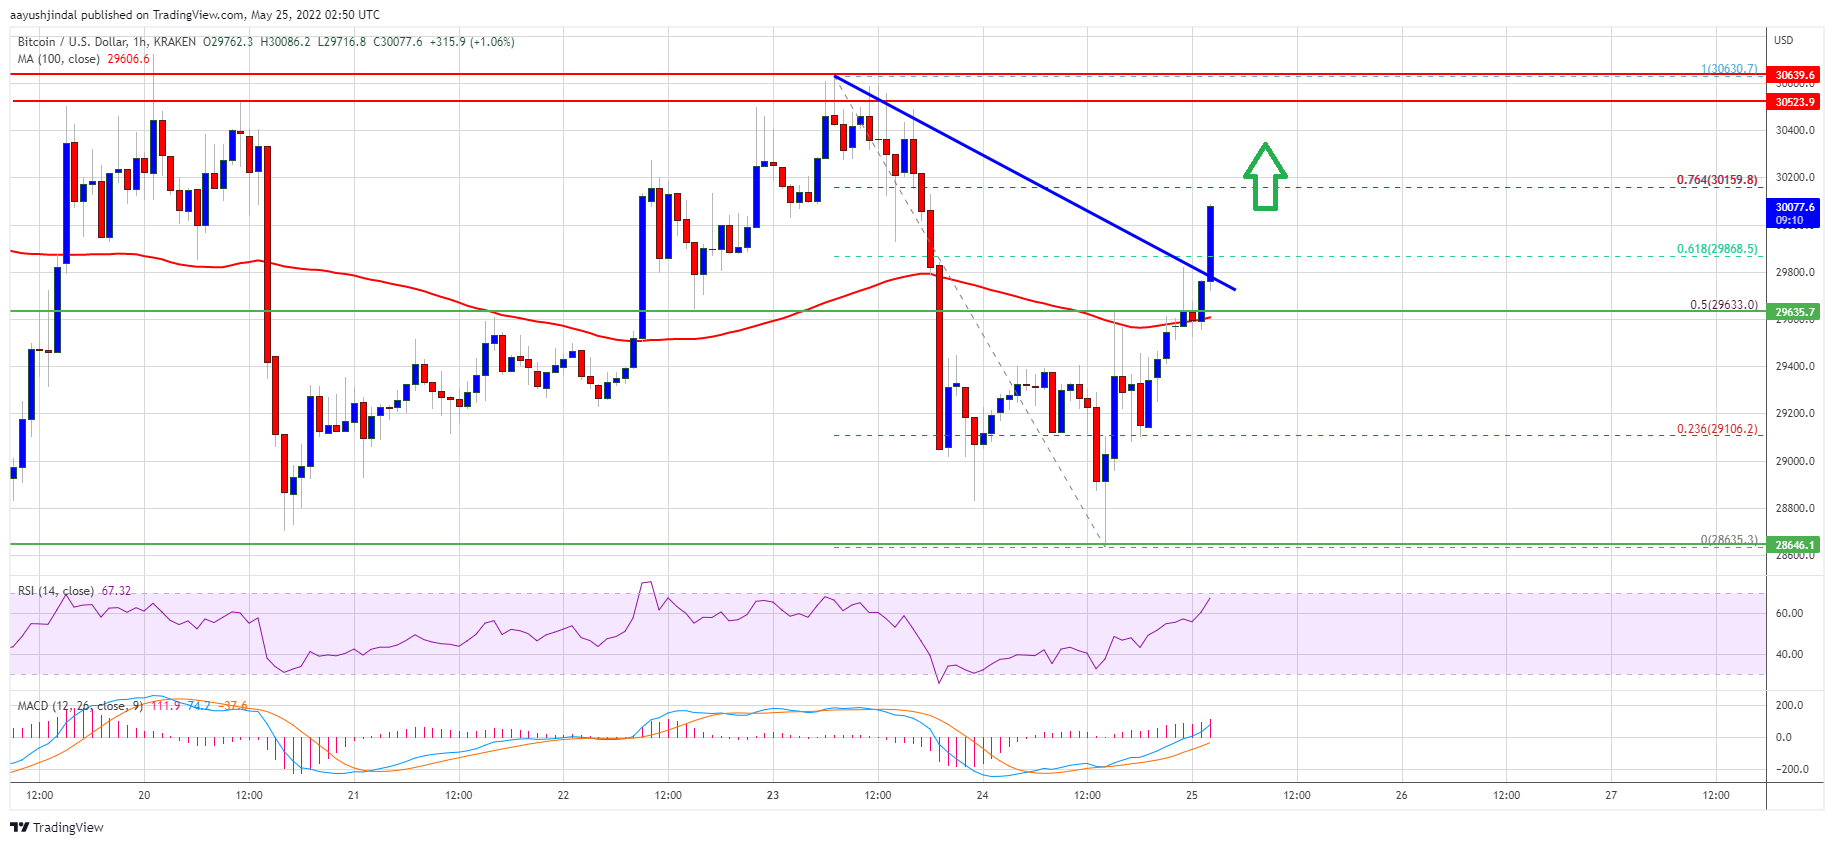
The price is now trading above the $29,500 level and the 100 hourly simple moving average.
There was break above a major bearish trend line with resistance near $29,800 on the hourly chart of the BTC/USD pair (data feed from Kraken).
The pair could continue to move higher towards the key $30,600 resistance zone.
Bitcoin Price Forms Triple Bottom
Bitcoin price extended decline below the $29,500 support zone. However, the bulls were active near the main $28,500 support zone.
A fresh base was formed near $28,600 and the price started a fresh increase. There was a clear move above the $29,200 and $29,500 resistance levels. The price surpassed the 50% Fib retracement level of the downward move from the $30,630 swing high to $28,635 low.
Besides, there was break above a major bearish trend line with resistance near $29,800 on the hourly chart of the BTC/USD pair. Bitcoin price is now trading above the $29,500 level and the 100 hourly simple moving average.
Source: BTCUSD on TradingView.com
An immediate resistance on the upside is near the $30,160 level. It is near the 76.4% Fib retracement level of the downward move from the $30,630 swing high to $28,635 low. The next major resistance is near the $30,600 level. A clear move above the $30,600 resistance level might start a steady increase. In the stated case, the price may perhaps clear the $31,200 resistance zone.
Fresh Decline in BTC?
If bitcoin fails to clear the $30,600 resistance zone, it could start another decline. An immediate support on the downside is near the $29,600 level.
The first major support is near the $29,500 level and the 100 hourly simple moving average. A downside break below the $29,500 support might send the price further lower. The main support is still near the $28,500 level, where the bulls are likely to take a strong stand.
Technical indicators:
Hourly MACD – The MACD is now gaining pace in the bullish zone.
Hourly RSI (Relative Strength Index) – The RSI for BTC/USD is now well above the 50 level.
Major Support Levels – $29,500, followed by $28,500.
Major Resistance Levels – $30,150, $30,500 and $30,600.
Bitcoin remained strong above the $28,500 support against the US Dollar. BTC is rising, but it must clear $28,500 to move into a positive zone.
Bitcoin started a fresh increase after it tested the $28,500 support zone.
The price is now trading above the $29,500 level and the 100 hourly simple moving average.
There was break above a major bearish trend line with resistance near $29,800 on the hourly chart of the BTC/USD pair (data feed from Kraken).
The pair could continue to move higher towards the key $30,600 resistance zone.
Bitcoin price extended decline below the $29,500 support zone. However, the bulls were active near the main $28,500 support zone.
A fresh base was formed near $28,600 and the price started a fresh increase. There was a clear move above the $29,200 and $29,500 resistance levels. The price surpassed the 50% Fib retracement level of the downward move from the $30,630 swing high to $28,635 low.
Besides, there was break above a major bearish trend line with resistance near $29,800 on the hourly chart of the BTC/USD pair. Bitcoin price is now trading above the $29,500 level and the 100 hourly simple moving average.
Source: BTCUSD on TradingView.com
An immediate resistance on the upside is near the $30,160 level. It is near the 76.4% Fib retracement level of the downward move from the $30,630 swing high to $28,635 low. The next major resistance is near the $30,600 level. A clear move above the $30,600 resistance level might start a steady increase. In the stated case, the price may perhaps clear the $31,200 resistance zone.
If bitcoin fails to clear the $30,600 resistance zone, it could start another decline. An immediate support on the downside is near the $29,600 level.
The first major support is near the $29,500 level and the 100 hourly simple moving average. A downside break below the $29,500 support might send the price further lower. The main support is still near the $28,500 level, where the bulls are likely to take a strong stand.
Technical indicators:
Hourly MACD – The MACD is now gaining pace in the bullish zone.
Hourly RSI (Relative Strength Index) – The RSI for BTC/USD is now well above the 50 level.
Major Support Levels – $29,500, followed by $28,500.
Major Resistance Levels – $30,150, $30,500 and $30,600.
Tags: bitcoinbtcusdBTCUSDTxbtusd
FeedzyRead More
Over the past week, the Bitcoin price kept on putting in consecutive lows, with barely…
Over the past week, the Bitcoin price kept on putting in consecutive lows, with barely…
Despite the price recovery, the Crypto Fear & Greed Index remains in “extreme fear,” indicating…
Michael Saylor’s latest message is blunt and direct: “Go Bitcoin today — the money won’t…
After a dour performance throughout the week, the price of Bitcoin experienced a fair amount…
As Bitcoin (BTC) trades roughly 50% below its all‑time high, investors are once again asking…