Bitcoin started a fresh decline below the $20,000 support zone against the US Dollar. BTC traded below $19,000 and remains at a risk of a move to $18,000.
Bitcoin started a fresh decline and traded below the $19,500 support.
The price is now trading below $19,200 and the 100 hourly simple moving average.
There was a break below a connecting bullish trend line with support at $19,850 on the hourly chart of the BTC/USD pair (data feed from Kraken).
The pair is now at a risk of a move towards the $18,000 support zone in the near term.
Bitcoin Price Starts Fresh Decline
Bitcoin price failed to surpass the $20,500 resistance level. BTC started a fresh decline and traded below the $20,000 and $19,500 support levels.
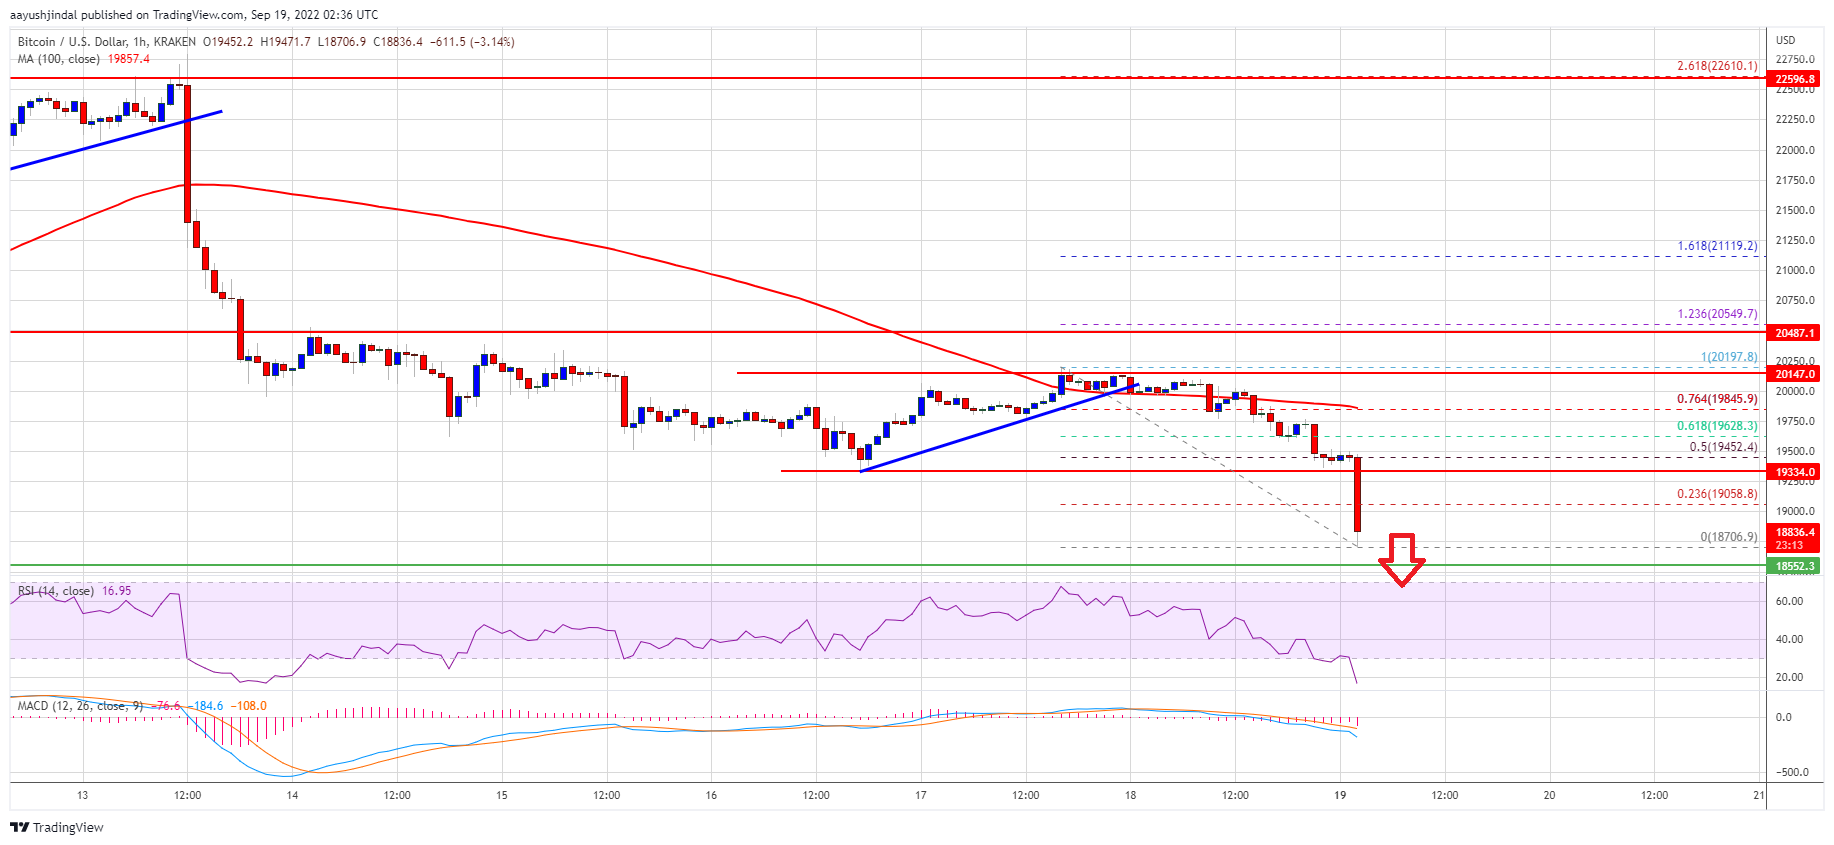
Besides, there was a break below a connecting bullish trend line with support at $19,850 on the hourly chart of the BTC/USD pair. The pair accelerated lower below the $19,200 level and the 100 hourly simple moving average. It even declined below $19,000 and traded as low as $18,706.
Bitcoin price is now consolidating losses below $19,200 and the 100 hourly simple moving average. On the upside, an immediate resistance is near the $19,050 level. It is near the 23.6% Fib retracement level of the recent decline from the $20,197 swing high to $18,706 low.
The next major resistance sits near the $19,350 level. It coincides with the 50% Fib retracement level of the recent decline from the $20,197 swing high to $18,706 low.
Source: BTCUSD on TradingView.com
The main barrier is now forming near the $20,000 zone and the 100 hourly simple moving average. A close above the $20,000 resistance might start a fresh increase. In the stated case, the price may perhaps rise towards $21,200.
More Losses in BTC?
If bitcoin fails to start a recovery wave above the $19,050 resistance zone, it could continue to move down. An immediate support on the downside is near the $18,700 zone.
The next major support is near the $18,550 level. A clear move below the $18,700 and $18,550 levels might open the doors for a move towards the $18,000 level.
Technical indicators:
Hourly MACD – The MACD is now gaining pace in the bearish zone.
Hourly RSI (Relative Strength Index) – The RSI for BTC/USD is now below the 50 level.
Major Support Levels – $18,700, followed by $18,550.
Major Resistance Levels – $19,050, $19,300 and $19,500.
Bitcoin started a fresh decline below the $20,000 support zone against the US Dollar. BTC traded below $19,000 and remains at a risk of a move to $18,000.
Bitcoin started a fresh decline and traded below the $19,500 support.
The price is now trading below $19,200 and the 100 hourly simple moving average.
There was a break below a connecting bullish trend line with support at $19,850 on the hourly chart of the BTC/USD pair (data feed from Kraken).
The pair is now at a risk of a move towards the $18,000 support zone in the near term.
Bitcoin price failed to surpass the $20,500 resistance level. BTC started a fresh decline and traded below the $20,000 and $19,500 support levels.
Besides, there was a break below a connecting bullish trend line with support at $19,850 on the hourly chart of the BTC/USD pair. The pair accelerated lower below the $19,200 level and the 100 hourly simple moving average. It even declined below $19,000 and traded as low as $18,706.
Bitcoin price is now consolidating losses below $19,200 and the 100 hourly simple moving average. On the upside, an immediate resistance is near the $19,050 level. It is near the 23.6% Fib retracement level of the recent decline from the $20,197 swing high to $18,706 low.
The next major resistance sits near the $19,350 level. It coincides with the 50% Fib retracement level of the recent decline from the $20,197 swing high to $18,706 low.
Source: BTCUSD on TradingView.com
The main barrier is now forming near the $20,000 zone and the 100 hourly simple moving average. A close above the $20,000 resistance might start a fresh increase. In the stated case, the price may perhaps rise towards $21,200.
If bitcoin fails to start a recovery wave above the $19,050 resistance zone, it could continue to move down. An immediate support on the downside is near the $18,700 zone.
The next major support is near the $18,550 level. A clear move below the $18,700 and $18,550 levels might open the doors for a move towards the $18,000 level.
Technical indicators:
Hourly MACD – The MACD is now gaining pace in the bearish zone.
Hourly RSI (Relative Strength Index) – The RSI for BTC/USD is now below the 50 level.
Major Support Levels – $18,700, followed by $18,550.
Major Resistance Levels – $19,050, $19,300 and $19,500.
Tags: bitcoinbtcusdBTCUSDTxbtusd
NewsBTCRead More
On-chain analytics firm Glassnode has explained how a flip in Bitcoin short-term holder profitability could…
A crypto analyst is calling for a $40,000 Bitcoin price surge within 60 days, and…
As Bitcoin (BTC) seeks to solidify its position around $71,000, the cryptocurrency faces a challenge…
Bitcoin and crypto exchanges built much of the cryptocurrency industry’s reputation by challenging traditional finance.…
Bitcoin Magazine AI Pivot Won’t Save Everyone, Wintermute Tells Bitcoin Miners Bitcoin miners are caught…
Bitcoin Magazine South African Eskom Considering Discount Power for Bitcoin Miners as Solar Creates Surplus…