Bitcoin price gained pace above the $23,500 resistance against the US Dollar. BTC could start a fresh increase if it stays above the $23,500 pivot level.
Bitcoin started a decent increase above the $23,500 level.
The price is now trading above the $23,500 level and the 100 hourly simple moving average.
There is a key bullish trend line forming with support near $23,500 on the hourly chart of the BTC/USD pair (data feed from Kraken).
The pair must clear the $24,000 resistance to start a fresh increase in the near term.
Bitcoin Price Remains Supported
Bitcoin price was stable above the $23,000 and $23,200 levels. The price formed a base above the $23,200 level and started a fresh increase.
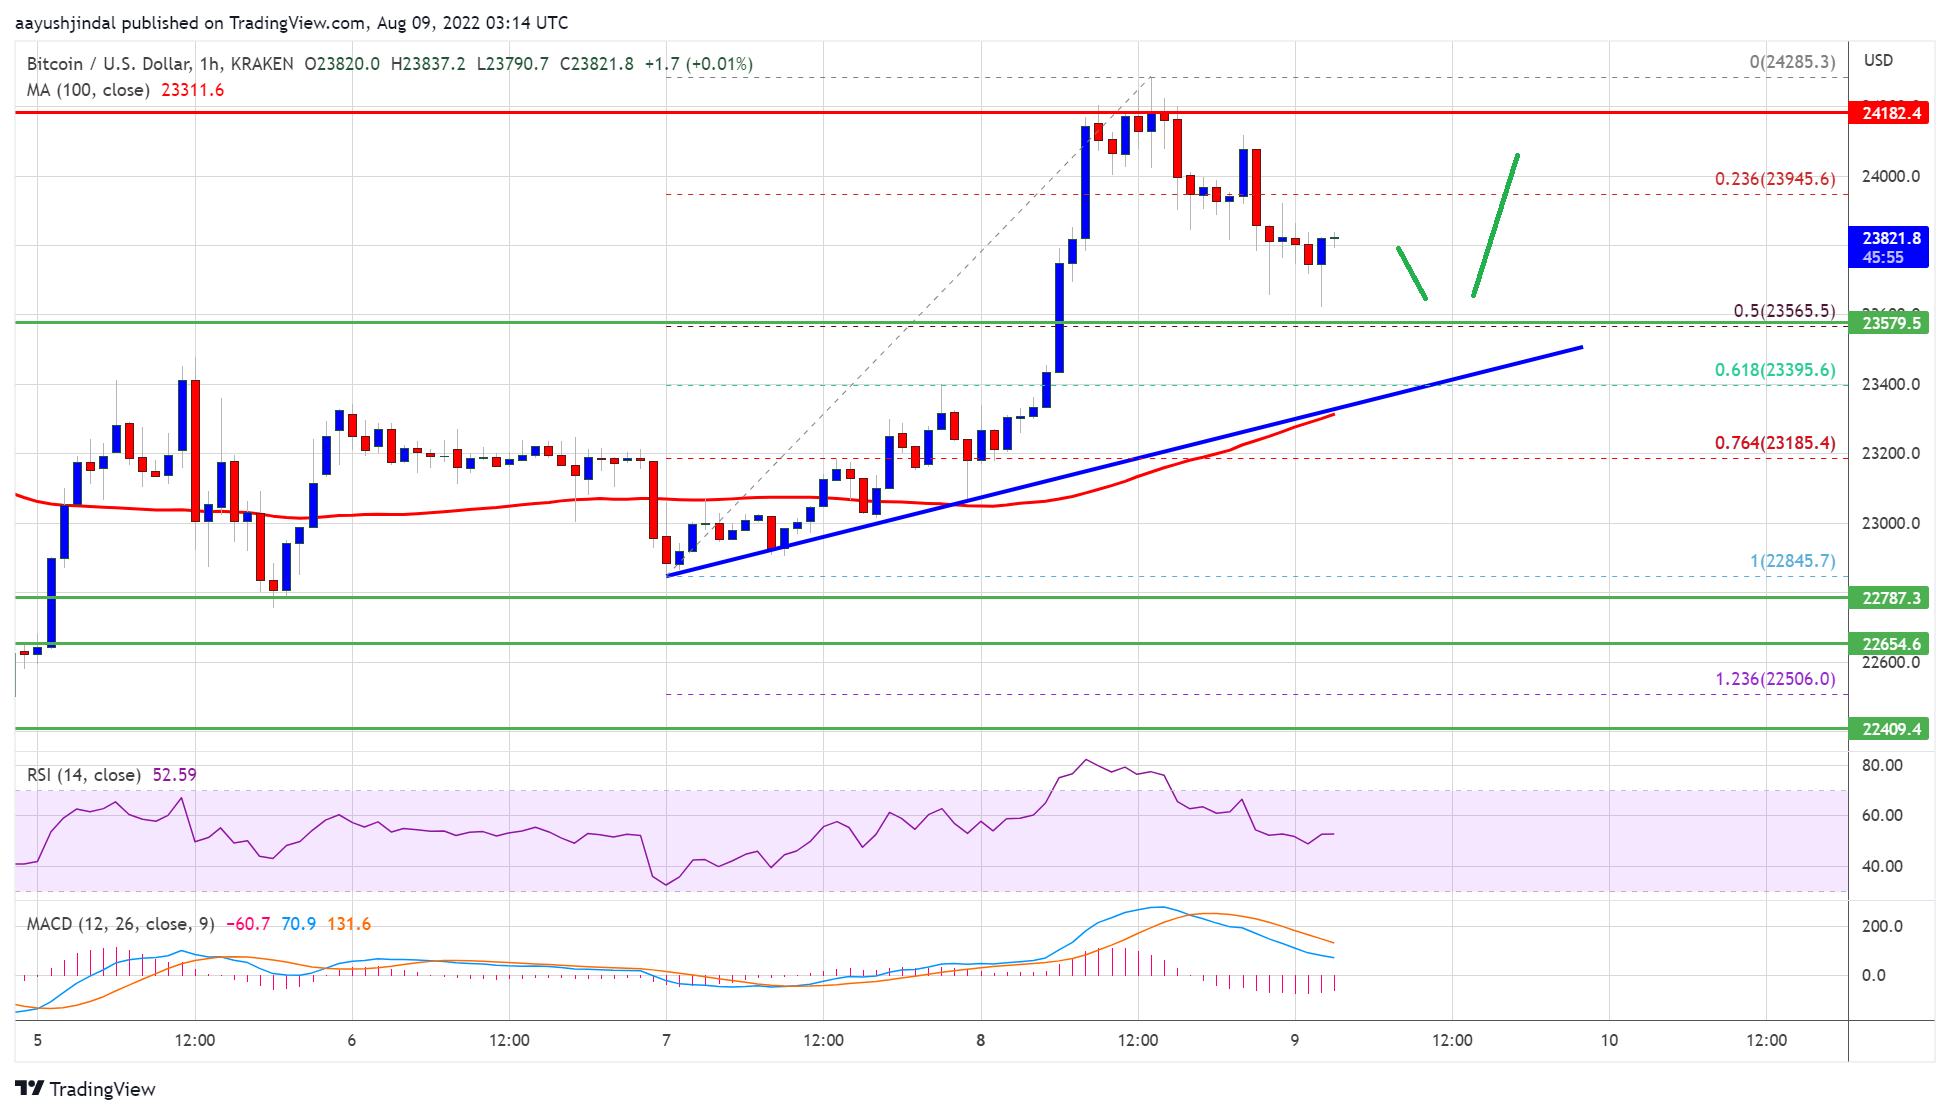
There was a clear move above the $23,500 resistance zone. The bulls were able to push the price above the $24,000 resistance zone and there was a close above the 100 hourly simple moving average. There was a spike above the $24,200 level.
A high was formed near $24,285 and the price is now correcting lower. There was a break below the $24,000 level. Bitcoin price dipped below the 23.6% Fib retracement level of the upward move from the $22,845 swing low to $24,285 high.
However, the price remained stable above the $23,600 level. There is also a key bullish trend line forming with support near $23,500 on the hourly chart of the BTC/USD pair.
Source: BTCUSD on TradingView.com
On the upside, an immediate resistance is near the $24,000 level. The next key resistance is near the $24,200 zone. A close above the $24,200 resistance zone could start a steady increase. In the stated case, the price may perhaps rise clear the $25,000 resistance.
Downside Break in BTC?
If bitcoin fails to clear the $24,000 resistance zone, it could start a downside correction. An immediate support on the downside is near the $23,600 level.
The next major support now sits near the $23,500 level. It is near the 50% Fib retracement level of the upward move from the $22,845 swing low to $24,285 high. A close below the $23,500 level might start a move towards $23,000. Any more losses might send the price towards $22,500 level.
Technical indicators:
Hourly MACD – The MACD is now gaining pace in the bullish zone.
Hourly RSI (Relative Strength Index) – The RSI for BTC/USD is now above the 50 level.
Major Support Levels – $23,600, followed by $23,500.
Major Resistance Levels – $24,000, $24,200 and $24,500.
Bitcoin price gained pace above the $23,500 resistance against the US Dollar. BTC could start a fresh increase if it stays above the $23,500 pivot level.
Bitcoin started a decent increase above the $23,500 level.
The price is now trading above the $23,500 level and the 100 hourly simple moving average.
There is a key bullish trend line forming with support near $23,500 on the hourly chart of the BTC/USD pair (data feed from Kraken).
The pair must clear the $24,000 resistance to start a fresh increase in the near term.
Bitcoin price was stable above the $23,000 and $23,200 levels. The price formed a base above the $23,200 level and started a fresh increase.
There was a clear move above the $23,500 resistance zone. The bulls were able to push the price above the $24,000 resistance zone and there was a close above the 100 hourly simple moving average. There was a spike above the $24,200 level.
A high was formed near $24,285 and the price is now correcting lower. There was a break below the $24,000 level. Bitcoin price dipped below the 23.6% Fib retracement level of the upward move from the $22,845 swing low to $24,285 high.
However, the price remained stable above the $23,600 level. There is also a key bullish trend line forming with support near $23,500 on the hourly chart of the BTC/USD pair.
Source: BTCUSD on TradingView.com
On the upside, an immediate resistance is near the $24,000 level. The next key resistance is near the $24,200 zone. A close above the $24,200 resistance zone could start a steady increase. In the stated case, the price may perhaps rise clear the $25,000 resistance.
If bitcoin fails to clear the $24,000 resistance zone, it could start a downside correction. An immediate support on the downside is near the $23,600 level.
The next major support now sits near the $23,500 level. It is near the 50% Fib retracement level of the upward move from the $22,845 swing low to $24,285 high. A close below the $23,500 level might start a move towards $23,000. Any more losses might send the price towards $22,500 level.
Technical indicators:
Hourly MACD – The MACD is now gaining pace in the bullish zone.
Hourly RSI (Relative Strength Index) – The RSI for BTC/USD is now above the 50 level.
Major Support Levels – $23,600, followed by $23,500.
Major Resistance Levels – $24,000, $24,200 and $24,500.
Tags: bitcoinbtcusdBTCUSDTxbtusd
NewsBTCRead More
Tokyo-listed Metaplanet is expanding beyond holding BTC into funding, incubating, and granting to companies building…
The bridging protocol's team wants to exchange ACX tokens for equity in a new U.S.…
Brent crude surged 10% after attacks on two oil tankers in Iraqi waters, with the…
Bitcoin price failed to extend its recovery wave above the $70,500 zone. BTC is now…
Bitcoin Magazine Coinbase CPO Rejects Claims of Opposing Bitcoin Tax Relief as Jack Dorsey Demands…
The security architecture surrounding Bitcoin continues to evolve as new infrastructure emerges to support self-custody…