Bitcoin is consolidating above the $19,500 support against the US Dollar. BTC could start a major increase considering the recent rise in ether.
Bitcoin is still trading in range near the $20,000 zone and below the $20,500 resistance.
The price is now trading below the $20,000 level and the 100 hourly simple moving average.
There is a key bullish trend line forming with support near $19,700 on the hourly chart of the BTC/USD pair (data feed from Kraken).
The pair could start a decent increase unless there is a clear move below the $19,600 and $19,500 levels.
Bitcoin Price Eyes Fresh Increase
Bitcoin price remained in a range below the $20,500 and $20,550 resistance levels. Recently, BTC formed a support base above the $19,600 level and started an upside correction.
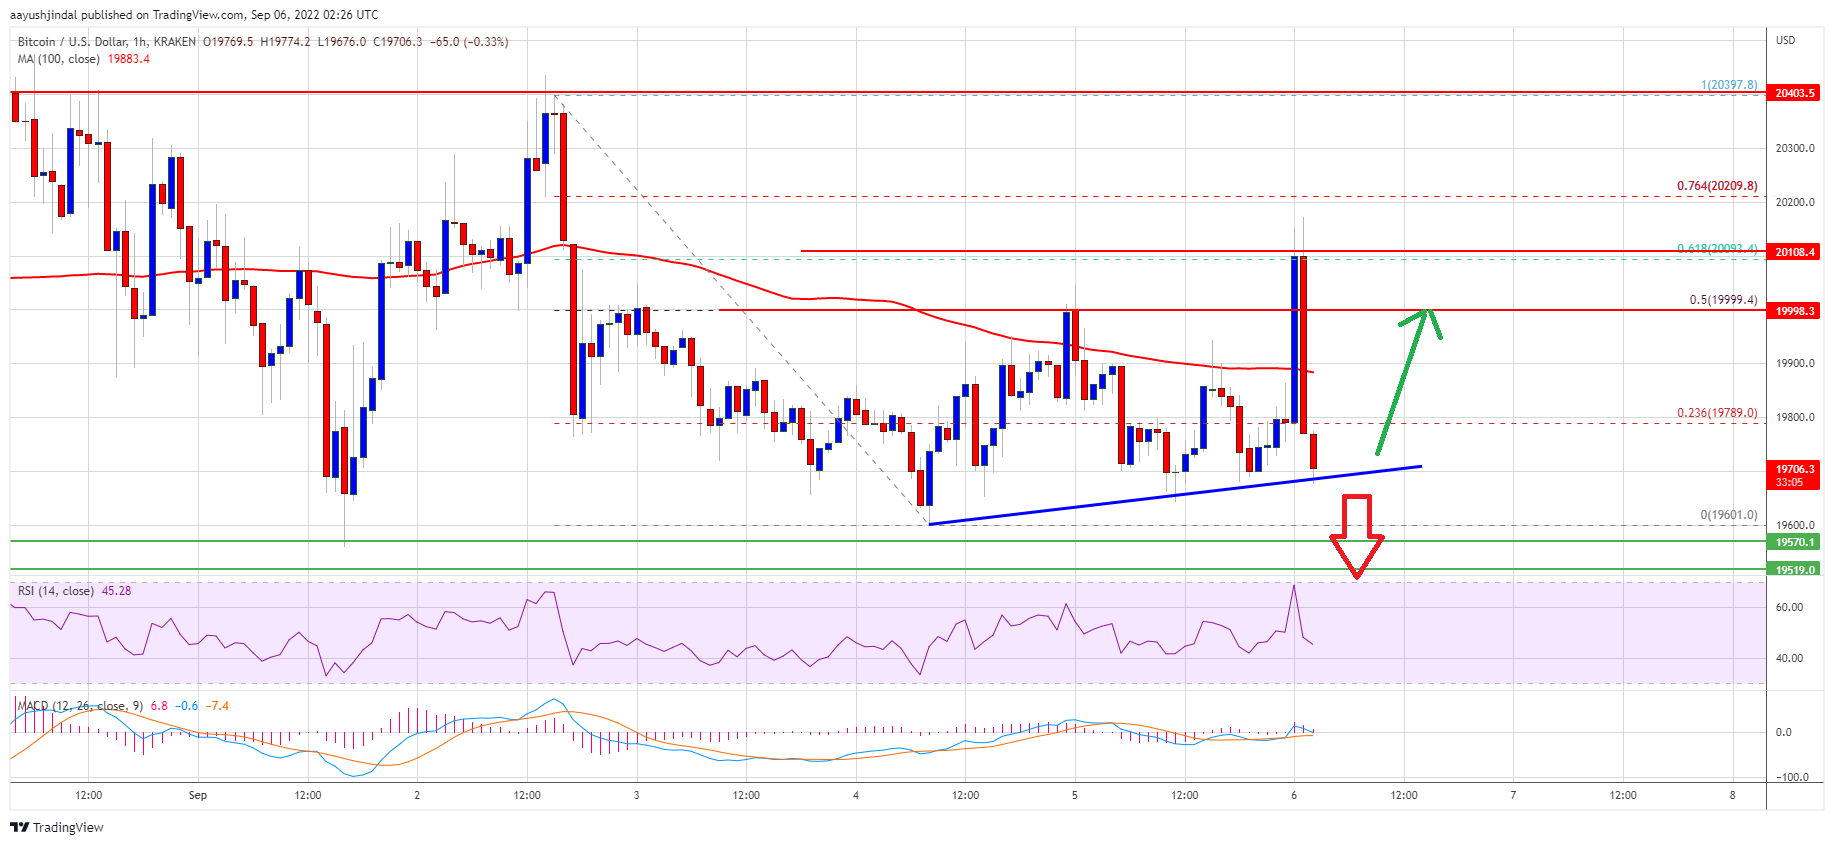
There was a move above the $19,800 resistance level and the 100 hourly simple moving average. The bulls were able to push the price above the 50% Fib retracement level of the downward move from the $20,398 swing high to $19,600 low.
Finally, there was a spike above the $20,000 resistance. However, the bears were active near the $20,100 zone. Bitcoin price failed to clear the 61.8% Fib retracement level of the downward move from the $20,398 swing high to $19,600 low.
It is now trading below the $20,000 level and the 100 hourly simple moving average. There is also a key bullish trend line forming with support near $19,700 on the hourly chart of the BTC/USD pair.
Source: BTCUSD on TradingView.com
On the upside, an immediate resistance is near the $19,900 level and the 100 hourly simple moving average. The next major resistance sits near the $20,100 level. The main resistance is still near the $20,400 and $20,500 levels. A clear move above the $20,500 resistance might send the price towards $21,200. Any more gains might start push the price towards the $22,000 resistance zone.
Downside Break in BTC?
If bitcoin fails to clear the $20,400 resistance zone, it could start another decline. An immediate support on the downside is near the $19,700 zone and the trend line.
The next major support sits near the $19,600 level. The main support sits near the $19,500 level. A clear move below the $19,500 support might start a major decline. In the stated case, the price may perhaps test the $18,500 support.
Technical indicators:
Hourly MACD – The MACD is now losing pace in the bullish zone.
Hourly RSI (Relative Strength Index) – The RSI for BTC/USD is now near the 50 level.
Major Support Levels – $19,700, followed by $19,500.
Major Resistance Levels – $20,000, $20,400 and $20,500.
Bitcoin is consolidating above the $19,500 support against the US Dollar. BTC could start a major increase considering the recent rise in ether.
Bitcoin is still trading in range near the $20,000 zone and below the $20,500 resistance.
The price is now trading below the $20,000 level and the 100 hourly simple moving average.
There is a key bullish trend line forming with support near $19,700 on the hourly chart of the BTC/USD pair (data feed from Kraken).
The pair could start a decent increase unless there is a clear move below the $19,600 and $19,500 levels.
Bitcoin price remained in a range below the $20,500 and $20,550 resistance levels. Recently, BTC formed a support base above the $19,600 level and started an upside correction.
There was a move above the $19,800 resistance level and the 100 hourly simple moving average. The bulls were able to push the price above the 50% Fib retracement level of the downward move from the $20,398 swing high to $19,600 low.
Finally, there was a spike above the $20,000 resistance. However, the bears were active near the $20,100 zone. Bitcoin price failed to clear the 61.8% Fib retracement level of the downward move from the $20,398 swing high to $19,600 low.
It is now trading below the $20,000 level and the 100 hourly simple moving average. There is also a key bullish trend line forming with support near $19,700 on the hourly chart of the BTC/USD pair.
Source: BTCUSD on TradingView.com
On the upside, an immediate resistance is near the $19,900 level and the 100 hourly simple moving average. The next major resistance sits near the $20,100 level. The main resistance is still near the $20,400 and $20,500 levels. A clear move above the $20,500 resistance might send the price towards $21,200. Any more gains might start push the price towards the $22,000 resistance zone.
If bitcoin fails to clear the $20,400 resistance zone, it could start another decline. An immediate support on the downside is near the $19,700 zone and the trend line.
The next major support sits near the $19,600 level. The main support sits near the $19,500 level. A clear move below the $19,500 support might start a major decline. In the stated case, the price may perhaps test the $18,500 support.
Technical indicators:
Hourly MACD – The MACD is now losing pace in the bullish zone.
Hourly RSI (Relative Strength Index) – The RSI for BTC/USD is now near the 50 level.
Major Support Levels – $19,700, followed by $19,500.
Major Resistance Levels – $20,000, $20,400 and $20,500.
Tags: bitcoinbtcusdBTCUSDTxbtusd
NewsBTCRead More
Bitcoin and other risk assets have been whipsawed by President Donald J. Trump’s shifting rhetoric…
Bitcoin is struggling to reclaim $70,000. The price chart looks uninspiring. And according to the…
Crypto and equities sold off after the president's national address undermined a two-day rally built…
Brent crude futures on Hyperliquid recorded $46.6 million in liquidations, behind only ether and bitcoin.…
A cluster of roughly 650,000 Bitcoin sits at the $70,000–$72,000 price range — coins bought…
Bitcoin price started a recovery wave above $68,000. BTC is now struggling to surpass $68,800…