Bitcoin made another attempt to gain pace above the $45,000 resistance against the US Dollar. BTC is still consolidating and remain supported near $43,000.
Bitcoin spiked above the $45,000 resistance zone and traded as high as $45,349.
The price is trading above $43,000 and the 100 hourly simple moving average.
There is a major bullish trend line forming with support near $42,500 on the hourly chart of the BTC/USD pair (data feed from Kraken).
The pair could correct lower, but the bulls might be active near $43,000 or $42,500.
Bitcoin Price Remains Supported
Bitcoin price remained supported above the $43,000 level. BTC made another attempt to start a fresh increase above the $44,500 level. It even spiked above the $45,000 resistance level.
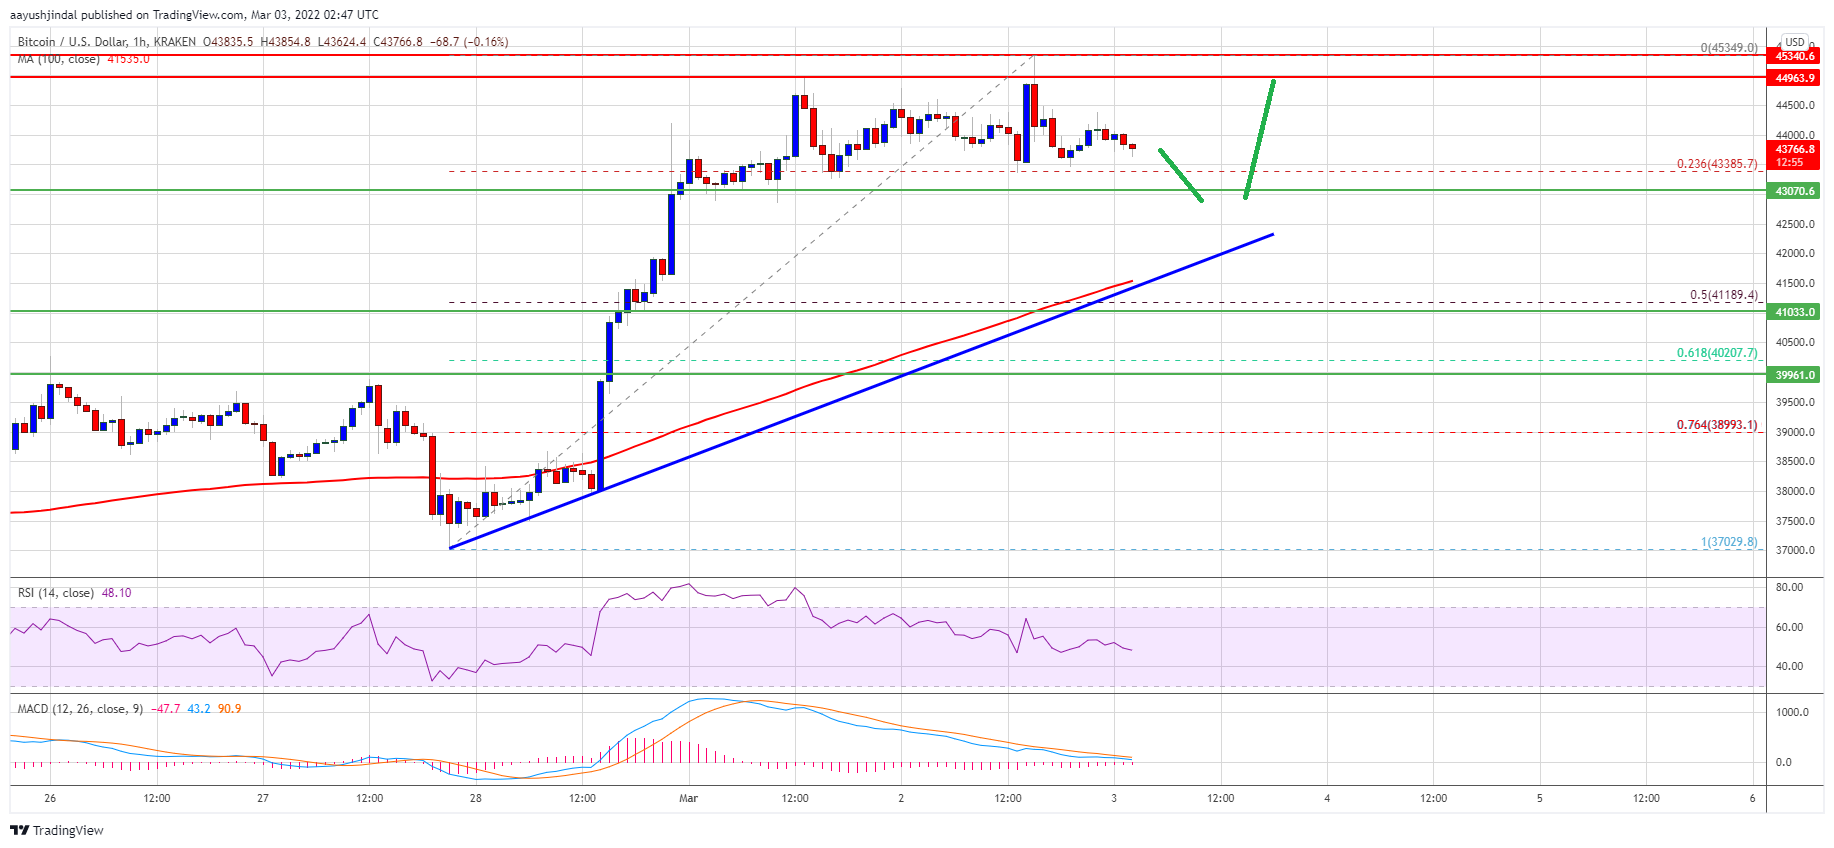
However, there was no upside continuation above $45,350. A high was formed near $45,349 and the price is now correcting gains. There was a move below the $45,000 and $44,500 levels. The price also tested the 23.6% Fib retracement level of the upward move from the $37,030 swing low to $45,349 high.
It is now trading above $43,000 and the 100 hourly simple moving average. There is also a major bullish trend line forming with support near $42,500 on the hourly chart of the BTC/USD pair.
Source: BTCUSD on TradingView.com
Bitcoin is now facing resistance is near the $44,250 level. The first key resistance is near the $45,000 level. A clear move above the $45,000 resistance might set the pace for a larger increase. In the stated case, the price could surpass $45,500 and test the $46,500 resistance zone. The next major resistance for the bulls may possibly be near the $47,200 level.
Dips Limited in BTC?
If bitcoin fails to clear the $45,000 resistance zone, it could start a downside correction. An immediate support on the downside is near the $43,380 zone.
The next major support is seen near the $43,000 level or the trend line support. If there is a downside break below the trend line support, the price might gain decline towards $41,200. It is near the 50% Fib retracement level of the upward move from the $37,030 swing low to $45,349 high.
Technical indicators:
Hourly MACD – The MACD is now losing pace in the bullish zone.
Hourly RSI (Relative Strength Index) – The RSI for BTC/USD is now near the 50 level.
Major Support Levels – $43,380, followed by $42,500.
Major Resistance Levels – $44,250, $45,000 and $45,350.
Bitcoin made another attempt to gain pace above the $45,000 resistance against the US Dollar. BTC is still consolidating and remain supported near $43,000.
Bitcoin spiked above the $45,000 resistance zone and traded as high as $45,349.
The price is trading above $43,000 and the 100 hourly simple moving average.
There is a major bullish trend line forming with support near $42,500 on the hourly chart of the BTC/USD pair (data feed from Kraken).
The pair could correct lower, but the bulls might be active near $43,000 or $42,500.
Bitcoin price remained supported above the $43,000 level. BTC made another attempt to start a fresh increase above the $44,500 level. It even spiked above the $45,000 resistance level.
However, there was no upside continuation above $45,350. A high was formed near $45,349 and the price is now correcting gains. There was a move below the $45,000 and $44,500 levels. The price also tested the 23.6% Fib retracement level of the upward move from the $37,030 swing low to $45,349 high.
It is now trading above $43,000 and the 100 hourly simple moving average. There is also a major bullish trend line forming with support near $42,500 on the hourly chart of the BTC/USD pair.
Source: BTCUSD on TradingView.com
Bitcoin is now facing resistance is near the $44,250 level. The first key resistance is near the $45,000 level. A clear move above the $45,000 resistance might set the pace for a larger increase. In the stated case, the price could surpass $45,500 and test the $46,500 resistance zone. The next major resistance for the bulls may possibly be near the $47,200 level.
If bitcoin fails to clear the $45,000 resistance zone, it could start a downside correction. An immediate support on the downside is near the $43,380 zone.
The next major support is seen near the $43,000 level or the trend line support. If there is a downside break below the trend line support, the price might gain decline towards $41,200. It is near the 50% Fib retracement level of the upward move from the $37,030 swing low to $45,349 high.
Technical indicators:
Hourly MACD – The MACD is now losing pace in the bullish zone.
Hourly RSI (Relative Strength Index) – The RSI for BTC/USD is now near the 50 level.
Major Support Levels – $43,380, followed by $42,500.
Major Resistance Levels – $44,250, $45,000 and $45,350.
Tags: bitcoinbtcusdBTCUSDTxbtusd
FeedzyRead More
At its last stage for government approval, the state's executive council rejected the bond project…
Bitcoin Magazine JPMorgan Says the Real Threat to Bitcoin Isn’t Strategy (MSTR) — It’s Private…
Redemption requests in the $2 trillion private credit market surged to $15.6 billion in the…
Bitcoin Magazine Bitcoin’s New Debt Machine is Facing Its First Major Test Public companies kept…
Compass Point analysts Michael Donovan and Ed Engel said markets are giving little credit to…
Bitcoin Magazine New Hampshire Council Rejects $100 Million Bitcoin-Backed Bond The New Hampshire Executive Council…