Bitcoin started a fresh increase above the $23,000 resistance zone against the US Dollar. BTC might continue to rise towards the $25,000 resistance zone.
Bitcoin started a fresh increase and climbed above the $23,000 resistance.
The price is now trading above the $23,000 level and the 100 hourly simple moving average.
There is a short-term contracting triangle forming with resistance near $24,000 on the hourly chart of the BTC/USD pair (data feed from Kraken).
The pair must clear the $24,000 resistance to continue higher in the near term.
Bitcoin Price Rises Steadily
Bitcoin price remained well bid above the $22,000 support zone. It formed a base above the $22,500 level and started a fresh increase. The price was able to gain pace for a move above the $23,000 resistance zone.
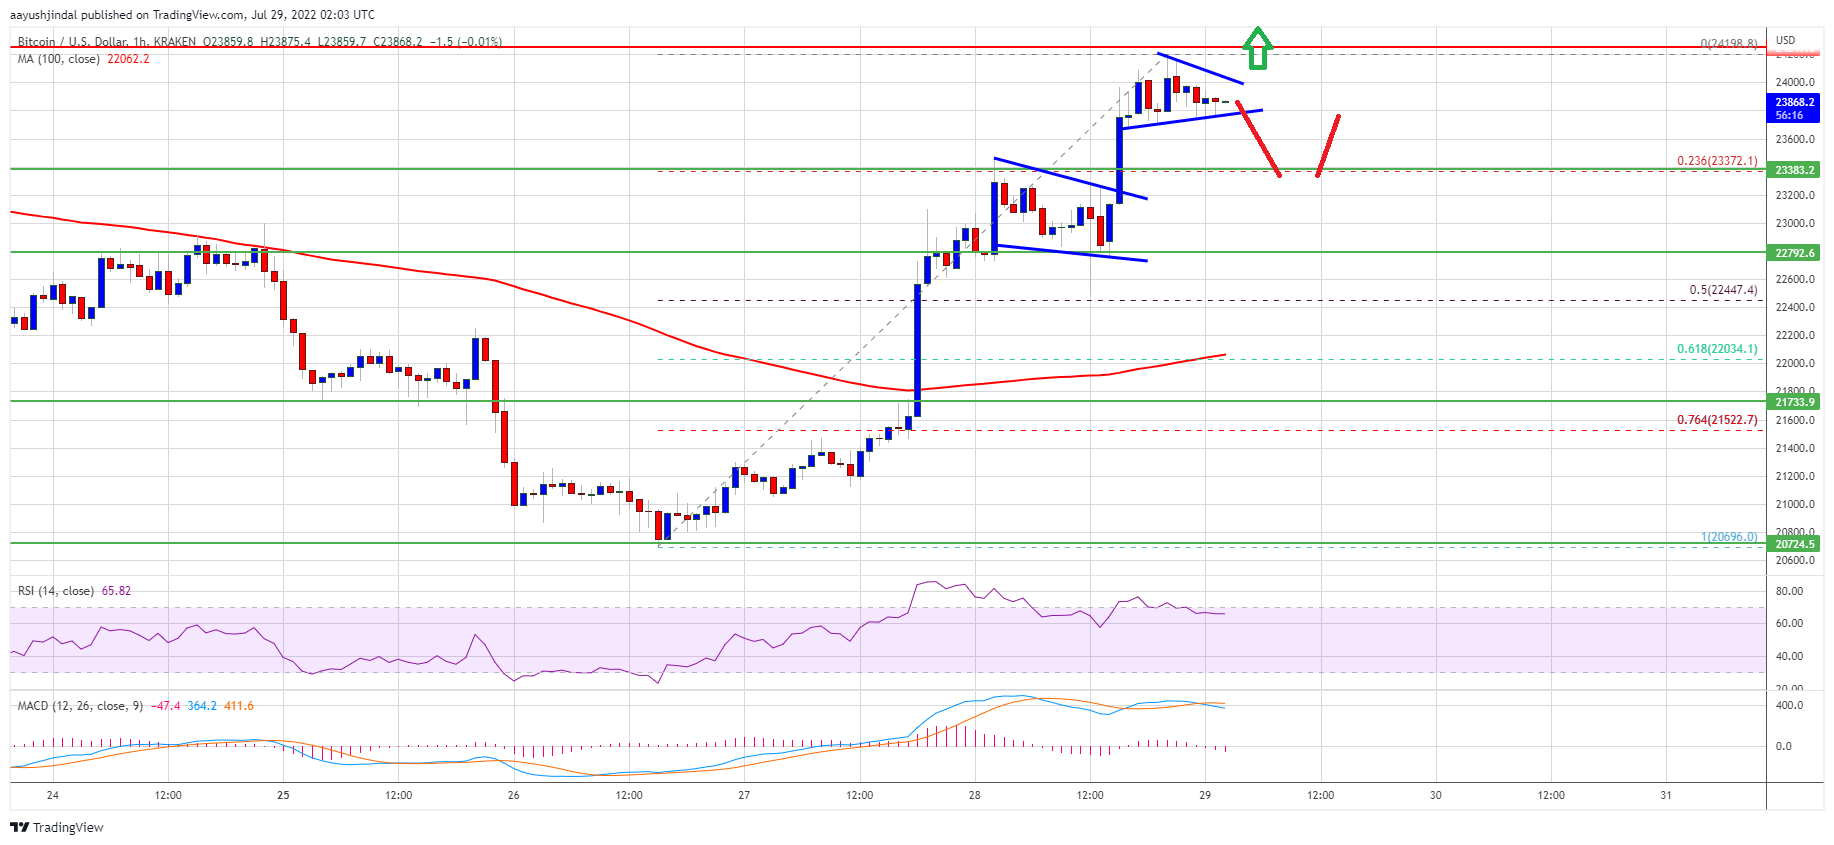
The bulls pumped the price above the $23,500 resistance. It even spiked above the $24,000 level and traded as high as $24,198. It is now trading above the $23,000 level and the 100 hourly simple moving average. There is also a short-term contracting triangle forming with resistance near $24,000 on the hourly chart of the BTC/USD pair.
It is also trading well above the 23.6% Fib retracement level of the upward move from the $20,696 swing low to $24,198 high. Bitcoin price is facing resistance near the $24,000 level.
Source: BTCUSD on TradingView.com
The next key resistance is near the $24,200 zone. A close above the $24,200 resistance zone could set the pace for more gains. In the stated case, the price may perhaps rise towards the $24,500 level. The next major resistance sits near the $25,000 level.
Dips Limited in BTC?
If bitcoin fails to clear the $24,000 resistance zone, it could start a downside correction. An immediate support on the downside is near the $23,740 level.
The next major support now sits near the $23,370 and $23,350 levels. Any more losses might send the price towards the 50% Fib retracement level of the upward move from the $20,696 swing low to $24,198 high at $22,450. A close below the $22,450 support zone might restart downtrend.
Technical indicators:
Hourly MACD – The MACD is now losing pace in the bullish zone.
Hourly RSI (Relative Strength Index) – The RSI for BTC/USD is now correcting towards 60.
Major Support Levels – $23,740, followed by $23,350.
Major Resistance Levels – $24,000, $24,200 and $25,000.
Bitcoin started a fresh increase above the $23,000 resistance zone against the US Dollar. BTC might continue to rise towards the $25,000 resistance zone.
Bitcoin started a fresh increase and climbed above the $23,000 resistance.
The price is now trading above the $23,000 level and the 100 hourly simple moving average.
There is a short-term contracting triangle forming with resistance near $24,000 on the hourly chart of the BTC/USD pair (data feed from Kraken).
The pair must clear the $24,000 resistance to continue higher in the near term.
Bitcoin price remained well bid above the $22,000 support zone. It formed a base above the $22,500 level and started a fresh increase. The price was able to gain pace for a move above the $23,000 resistance zone.
The bulls pumped the price above the $23,500 resistance. It even spiked above the $24,000 level and traded as high as $24,198. It is now trading above the $23,000 level and the 100 hourly simple moving average. There is also a short-term contracting triangle forming with resistance near $24,000 on the hourly chart of the BTC/USD pair.
It is also trading well above the 23.6% Fib retracement level of the upward move from the $20,696 swing low to $24,198 high. Bitcoin price is facing resistance near the $24,000 level.
Source: BTCUSD on TradingView.com
The next key resistance is near the $24,200 zone. A close above the $24,200 resistance zone could set the pace for more gains. In the stated case, the price may perhaps rise towards the $24,500 level. The next major resistance sits near the $25,000 level.
If bitcoin fails to clear the $24,000 resistance zone, it could start a downside correction. An immediate support on the downside is near the $23,740 level.
The next major support now sits near the $23,370 and $23,350 levels. Any more losses might send the price towards the 50% Fib retracement level of the upward move from the $20,696 swing low to $24,198 high at $22,450. A close below the $22,450 support zone might restart downtrend.
Technical indicators:
Hourly MACD – The MACD is now losing pace in the bullish zone.
Hourly RSI (Relative Strength Index) – The RSI for BTC/USD is now correcting towards 60.
Major Support Levels – $23,740, followed by $23,350.
Major Resistance Levels – $24,000, $24,200 and $25,000.
Tags: bitcoinbtcusdBTCUSDTxbtusd
NewsBTCRead More
Prominent analyst Darkfost shares that Bitcoin remains a long time away from establishing a new…
Over the last day, Bitcoin prices have remained within the $70,000 – $72,000 region, recording…
Each escalation in the Iran conflict has been larger than the last, but each bitcoin…
The Bitcoin price has not particularly impressed over the past two weeks, but it appears…
Bitcoin’s extended pullback from its all-time high has left traders in uncertainty, and many investors…
Bitcoin recently pushed into a key liquidity pocket near the $73,000 level, briefly tapping overhead…