Bitcoin price is holding gains above the $19,000 level against the US Dollar. BTC could rally if there is a clear move above the $19,660 resistance zone.
Bitcoin remained stable and consolidated above the $19,000 support zone.
The price is trading above $19,100 and the 100 hourly simple moving average.
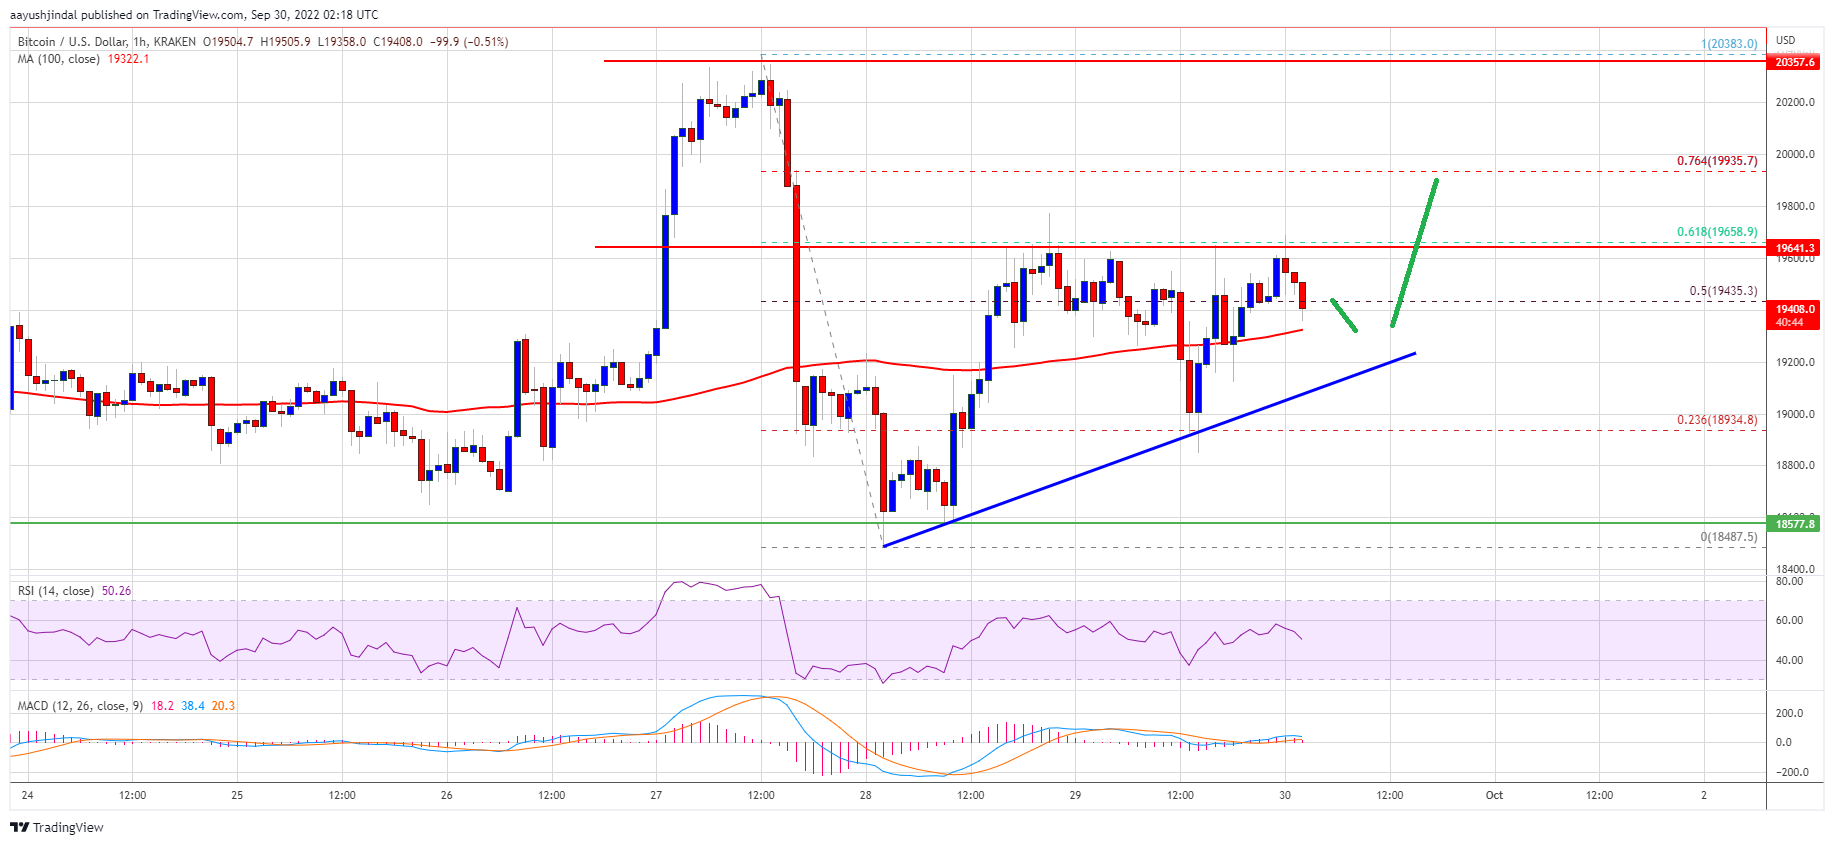
There is a key bullish trend line forming with support near $19,220 on the hourly chart of the BTC/USD pair (data feed from Kraken).
The pair could start a fresh surge if there is a clear move above the $19,660 resistance zone.
Bitcoin Price Consolidates
Bitcoin price started a recovery wave from the $18,500 support zone. BTC bulls remained active above the $18,500 level and managed to push the price above the $19,000 resistance zone.
There was a clear move above the 50% Fib retracement level of the key decline from the $20,382 swing high to $18,486 low. The price even climbed above the $19,500 resistance zone, but the bears were active near the $19,650 and $19,660 levels.
Bitcoin price is now consolidating above $19,100 and the 100 hourly simple moving average. There is also a key bullish trend line forming with support near $19,220 on the hourly chart of the BTC/USD pair.
On the upside, an immediate resistance is near the $19,500 level. The next major resistance sits near the $19,660 zone. It is close to the 61.8% Fib retracement level of the key decline from the $20,382 swing high to $18,486 low.
Source: BTCUSD on TradingView.com
A clear move above the $19,660 resistance might start a fresh increase. In the stated case, the price could even surpass the $20,000 resistance zone. The next major resistance is near the $20,500 zone, above which the price may perhaps revisit the $21,000 zone.
Another Drop in BTC?
If bitcoin fails to rise above the $19,660 resistance zone, it could start a fresh decline. An immediate support on the downside is near the $19,350 zone and the 100 hourly SMA.
The next major support is near the $19,220 zone and the bullish trend line. The main support is near $19,000. Any more losses might call for a drop towards the $18,500 support zone in the coming sessions.
Technical indicators:
Hourly MACD – The MACD is now losing pace in the bullish zone.
Hourly RSI (Relative Strength Index) – The RSI for BTC/USD is now above the 50 level.
Major Support Levels – $19,220, followed by $19,000.
Major Resistance Levels – $19,660, $20,000 and $20,500.
Bitcoin price is holding gains above the $19,000 level against the US Dollar. BTC could rally if there is a clear move above the $19,660 resistance zone.
Bitcoin remained stable and consolidated above the $19,000 support zone.
The price is trading above $19,100 and the 100 hourly simple moving average.
There is a key bullish trend line forming with support near $19,220 on the hourly chart of the BTC/USD pair (data feed from Kraken).
The pair could start a fresh surge if there is a clear move above the $19,660 resistance zone.
Bitcoin price started a recovery wave from the $18,500 support zone. BTC bulls remained active above the $18,500 level and managed to push the price above the $19,000 resistance zone.
There was a clear move above the 50% Fib retracement level of the key decline from the $20,382 swing high to $18,486 low. The price even climbed above the $19,500 resistance zone, but the bears were active near the $19,650 and $19,660 levels.
Bitcoin price is now consolidating above $19,100 and the 100 hourly simple moving average. There is also a key bullish trend line forming with support near $19,220 on the hourly chart of the BTC/USD pair.
On the upside, an immediate resistance is near the $19,500 level. The next major resistance sits near the $19,660 zone. It is close to the 61.8% Fib retracement level of the key decline from the $20,382 swing high to $18,486 low.
Source: BTCUSD on TradingView.com
A clear move above the $19,660 resistance might start a fresh increase. In the stated case, the price could even surpass the $20,000 resistance zone. The next major resistance is near the $20,500 zone, above which the price may perhaps revisit the $21,000 zone.
If bitcoin fails to rise above the $19,660 resistance zone, it could start a fresh decline. An immediate support on the downside is near the $19,350 zone and the 100 hourly SMA.
The next major support is near the $19,220 zone and the bullish trend line. The main support is near $19,000. Any more losses might call for a drop towards the $18,500 support zone in the coming sessions.
Technical indicators:
Hourly MACD – The MACD is now losing pace in the bullish zone.
Hourly RSI (Relative Strength Index) – The RSI for BTC/USD is now above the 50 level.
Major Support Levels – $19,220, followed by $19,000.
Major Resistance Levels – $19,660, $20,000 and $20,500.
Tags: bitcoinbtcusdBTCUSDTxbtusd
NewsBTCRead More
Bitcoin Magazine Why Legendary Investor Bill Miller IV has “Never Been More Bullish on Bitcoin”…
Bitcoin Magazine Strategy CEO Phong Le: We Want to Be the JPMorgan of Bitcoin Strategy’s…
Bitcoin Magazine Coinbase Policy Chief: Strategic Bitcoin Reserve Bill Outlook The Clarity Act’s cloture vote…
Bitcoin Magazine T. Rowe Price’s Blue Macellari: Bitcoin is Now Core to the Debasement Conversation…
Bitcoin Magazine Move Over Housing – Bitcoin is Gen Z’s New Wealth Building Asset Gen…
Market experts view bitcoin’s price stability as evidence of its fundamental independence from Washington, maintaining…