Bitcoin started a fresh increase above the $40,000 resistance against the US Dollar. BTC remains supported and might rally again above the $41,500 resistance.
Bitcoin reclaimed the $40,000 level and might continue to rise.
The price is trading above $40,200 and the 100 hourly simple moving average.
There is a major bullish trend line forming with support near $39,850 on the hourly chart of the BTC/USD pair (data feed from Kraken).
The pair might correct lower, but the bulls might remain active near the $40,000 zone.
Bitcoin Price Remains Elevated
Bitcoin price spiked towards the $41,500 level before it faced sellers. BTC reacted to the downside and even dived below the $40,000 level.
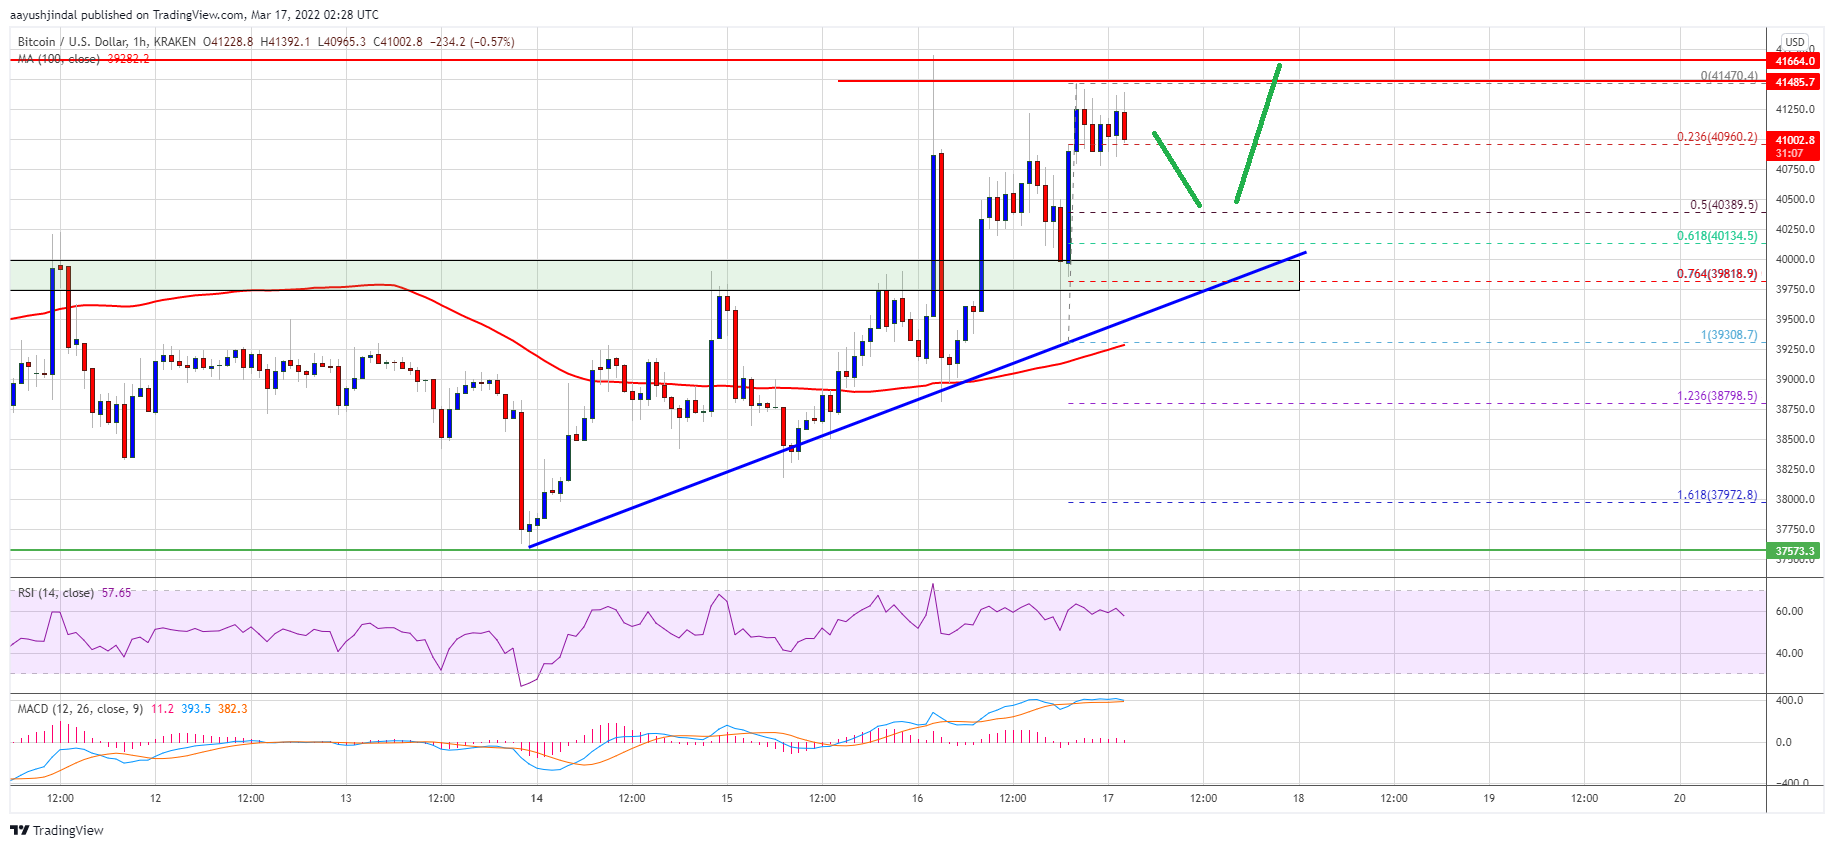
However, the bulls were active near the $39,000 zone and the 100 hourly simple moving average. There is also a major bullish trend line forming with support near $39,850 on the hourly chart of the BTC/USD pair. A low was formed near $39,300 and the price started a fresh increase. There was a clear move above the $40,000 resistance zone.
Bitcoin even climbed above the $40,800 level. It is now consolidating near the $41,000 resistance zone. There was a test of the 23.6% Fib retracement level of the upward move from the $39,308 swing low to $41,470 high.
Source: BTCUSD on TradingView.com
On the upside, the price is facing resistance near the $41,200 level. The next major resistance could be near the recent high or $41,600. A clear move above the $41,600 level could open the doors for another rally. In the stated case, the price might rise towards the $42,500 level. Any more gains might send the price towards the $43,200 level in the near term.
Dips Supported in BTC?
If bitcoin fails to clear the $41,600 resistance zone, it could start a downside correction. An immediate support on the downside is near the $40,500 zone.
The next major support is seen near the $40,300 level. It is near the 50% Fib retracement level of the upward move from the $39,308 swing low to $41,470 high. The main support is still near the $40,000 zone, below which the price might test $39,000.
Technical indicators:
Hourly MACD – The MACD is now losing pace in the bullish zone.
Hourly RSI (Relative Strength Index) – The RSI for BTC/USD is well above the 50 level.
Major Support Levels – $40,500, followed by $40,000.
Major Resistance Levels – $41,200, $41,600 and $42,500.
Bitcoin started a fresh increase above the $40,000 resistance against the US Dollar. BTC remains supported and might rally again above the $41,500 resistance.
Bitcoin reclaimed the $40,000 level and might continue to rise.
The price is trading above $40,200 and the 100 hourly simple moving average.
There is a major bullish trend line forming with support near $39,850 on the hourly chart of the BTC/USD pair (data feed from Kraken).
The pair might correct lower, but the bulls might remain active near the $40,000 zone.
Bitcoin price spiked towards the $41,500 level before it faced sellers. BTC reacted to the downside and even dived below the $40,000 level.
However, the bulls were active near the $39,000 zone and the 100 hourly simple moving average. There is also a major bullish trend line forming with support near $39,850 on the hourly chart of the BTC/USD pair. A low was formed near $39,300 and the price started a fresh increase. There was a clear move above the $40,000 resistance zone.
Bitcoin even climbed above the $40,800 level. It is now consolidating near the $41,000 resistance zone. There was a test of the 23.6% Fib retracement level of the upward move from the $39,308 swing low to $41,470 high.
Source: BTCUSD on TradingView.com
On the upside, the price is facing resistance near the $41,200 level. The next major resistance could be near the recent high or $41,600. A clear move above the $41,600 level could open the doors for another rally. In the stated case, the price might rise towards the $42,500 level. Any more gains might send the price towards the $43,200 level in the near term.
If bitcoin fails to clear the $41,600 resistance zone, it could start a downside correction. An immediate support on the downside is near the $40,500 zone.
The next major support is seen near the $40,300 level. It is near the 50% Fib retracement level of the upward move from the $39,308 swing low to $41,470 high. The main support is still near the $40,000 zone, below which the price might test $39,000.
Technical indicators:
Hourly MACD – The MACD is now losing pace in the bullish zone.
Hourly RSI (Relative Strength Index) – The RSI for BTC/USD is well above the 50 level.
Major Support Levels – $40,500, followed by $40,000.
Major Resistance Levels – $41,200, $41,600 and $42,500.
Tags: bitcoinbtcusdBTCUSDTxbtusd
FeedzyRead More
Strategy’s stock is trading below the value of its own Bitcoin holdings — an unusual…
The cryptocurrency community pushed back, with Michael Saylor saying Bitcoin has no issuer, promoter, or…
Crypto pundit Crypto Bully has shared his base case for Bitcoin and what to expect…
The past week recorded a significant change in the Bitcoin price action, where there was…
The largest publicly traded corporate holder of bitcoin would need to buy roughly 6,158 BTC…
On-chain analytics firm Glassnode has highlighted how Bitcoin has only seen a relatively thin accumulation…