Bitcoin extended losses and traded below $19,600 against the US Dollar. BTC could start a recovery wave if it stays above the $19,300 support zone.
Bitcoin remained in a bearish zone and settled below the $20,000 level.
The price is now trading below the $19,600 level and the 100 hourly simple moving average.
There is a major bearish trend line forming with resistance near $19,600 on the hourly chart of the BTC/USD pair (data feed from Kraken).
The pair might start a recovery wave if it stays above the $19,300 support zone.
Bitcoin Price Reaches Key Support
Bitcoin price started a fresh decline below the $21,000 support zone. The bears gained strength and pushed the price below the $20,000 support zone.
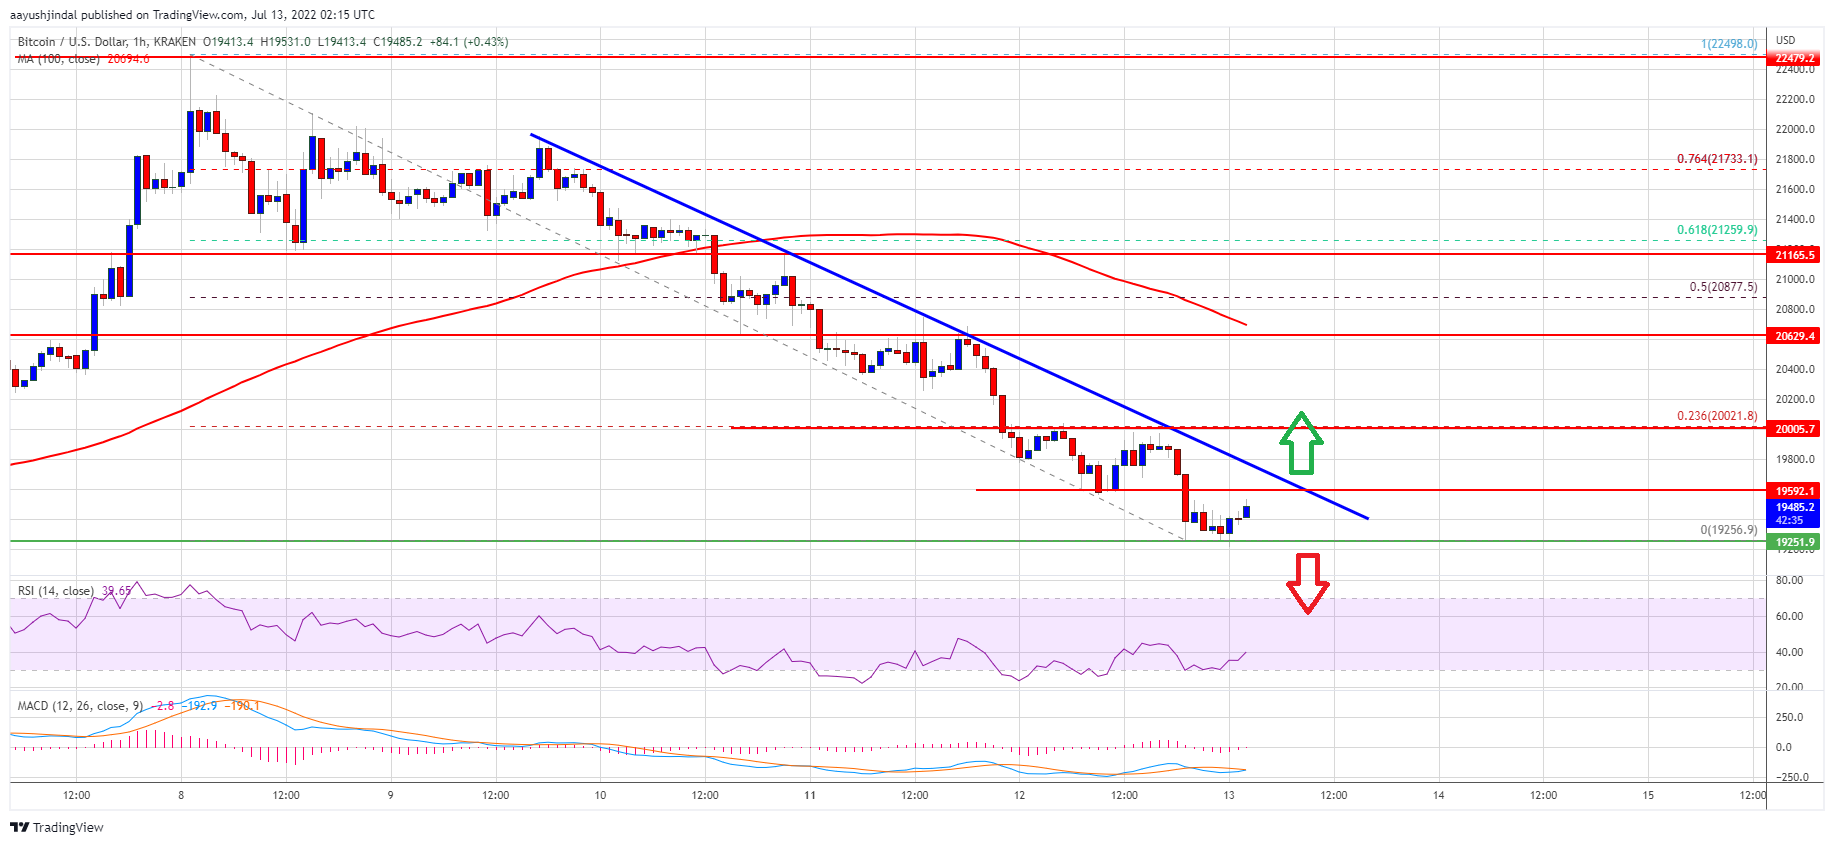
The decline even extended below the $19,600 support zone. A low is formed near $19,256 and the price is now consolidating near a major support at $19,300. It is also trading below the $19,600 level and the 100 hourly simple moving average.
If bitcoin stays above the $19,300 zone, it might start a recovery wave. On the upside, the price could resistance near the $19,550 and $19,600 levels.
There is also a major bearish trend line forming with resistance near $19,600 on the hourly chart of the BTC/USD pair. The next key resistance is near the $20,000 zone (the recent breakdown zone). It is near the 23.6% Fib retracement level of the downward move from the $22,498 swing high to $19,256 low.
Source: BTCUSD on TradingView.com
A close above the $20,000 resistance zone could set the pace for a test of the 100 hourly simple moving average. Any more gains might open the doors for a move towards the 50% Fib retracement level of the downward move from the $22,498 swing high to $19,256 low. The next major resistance sits near the $21,200 level.
More Losses in BTC?
If bitcoin fails to start a recovery wave above the $20,000 level, it could continue to move down. An immediate support on the downside is near the $19,300 level.
The next major support now sits near the $19,250 level or the recent low. A close below the $19,250 support zone could accelerate losses. In the stated case, there is a risk of a move towards the $18,500 level.
Technical indicators:
Hourly MACD – The MACD is now gaining pace in the bearish zone.
Hourly RSI (Relative Strength Index) – The RSI for BTC/USD is now in the oversold zone.
Major Support Levels – $19,300, followed by $18,500.
Major Resistance Levels – $19,600, $20,000 and $20,500.
Bitcoin extended losses and traded below $19,600 against the US Dollar. BTC could start a recovery wave if it stays above the $19,300 support zone.
Bitcoin remained in a bearish zone and settled below the $20,000 level.
The price is now trading below the $19,600 level and the 100 hourly simple moving average.
There is a major bearish trend line forming with resistance near $19,600 on the hourly chart of the BTC/USD pair (data feed from Kraken).
The pair might start a recovery wave if it stays above the $19,300 support zone.
Bitcoin price started a fresh decline below the $21,000 support zone. The bears gained strength and pushed the price below the $20,000 support zone.
The decline even extended below the $19,600 support zone. A low is formed near $19,256 and the price is now consolidating near a major support at $19,300. It is also trading below the $19,600 level and the 100 hourly simple moving average.
If bitcoin stays above the $19,300 zone, it might start a recovery wave. On the upside, the price could resistance near the $19,550 and $19,600 levels.
There is also a major bearish trend line forming with resistance near $19,600 on the hourly chart of the BTC/USD pair. The next key resistance is near the $20,000 zone (the recent breakdown zone). It is near the 23.6% Fib retracement level of the downward move from the $22,498 swing high to $19,256 low.
Source: BTCUSD on TradingView.com
A close above the $20,000 resistance zone could set the pace for a test of the 100 hourly simple moving average. Any more gains might open the doors for a move towards the 50% Fib retracement level of the downward move from the $22,498 swing high to $19,256 low. The next major resistance sits near the $21,200 level.
If bitcoin fails to start a recovery wave above the $20,000 level, it could continue to move down. An immediate support on the downside is near the $19,300 level.
The next major support now sits near the $19,250 level or the recent low. A close below the $19,250 support zone could accelerate losses. In the stated case, there is a risk of a move towards the $18,500 level.
Technical indicators:
Hourly MACD – The MACD is now gaining pace in the bearish zone.
Hourly RSI (Relative Strength Index) – The RSI for BTC/USD is now in the oversold zone.
Major Support Levels – $19,300, followed by $18,500.
Major Resistance Levels – $19,600, $20,000 and $20,500.
Tags: bitcoinbtcusdBTCUSDTxbtusd
FeedzyRead More
The Bitcoin market remains subject to high uncertainty, with bearish sentiments at heightened levels. In…
For the first time in nearly two months, the Bitcoin price had a sustained run…
On-chain data shows the Bitcoin sharks and whales have seen their population grow during the…
Bitcoin (BTC) has settled back into the familiar consolidation band between roughly $65,000 and $74,000…
Whale wallets quietly shifted to buying mode over the past two weeks — even as…
A crypto analyst has broken down everything investors and traders need to know about the…