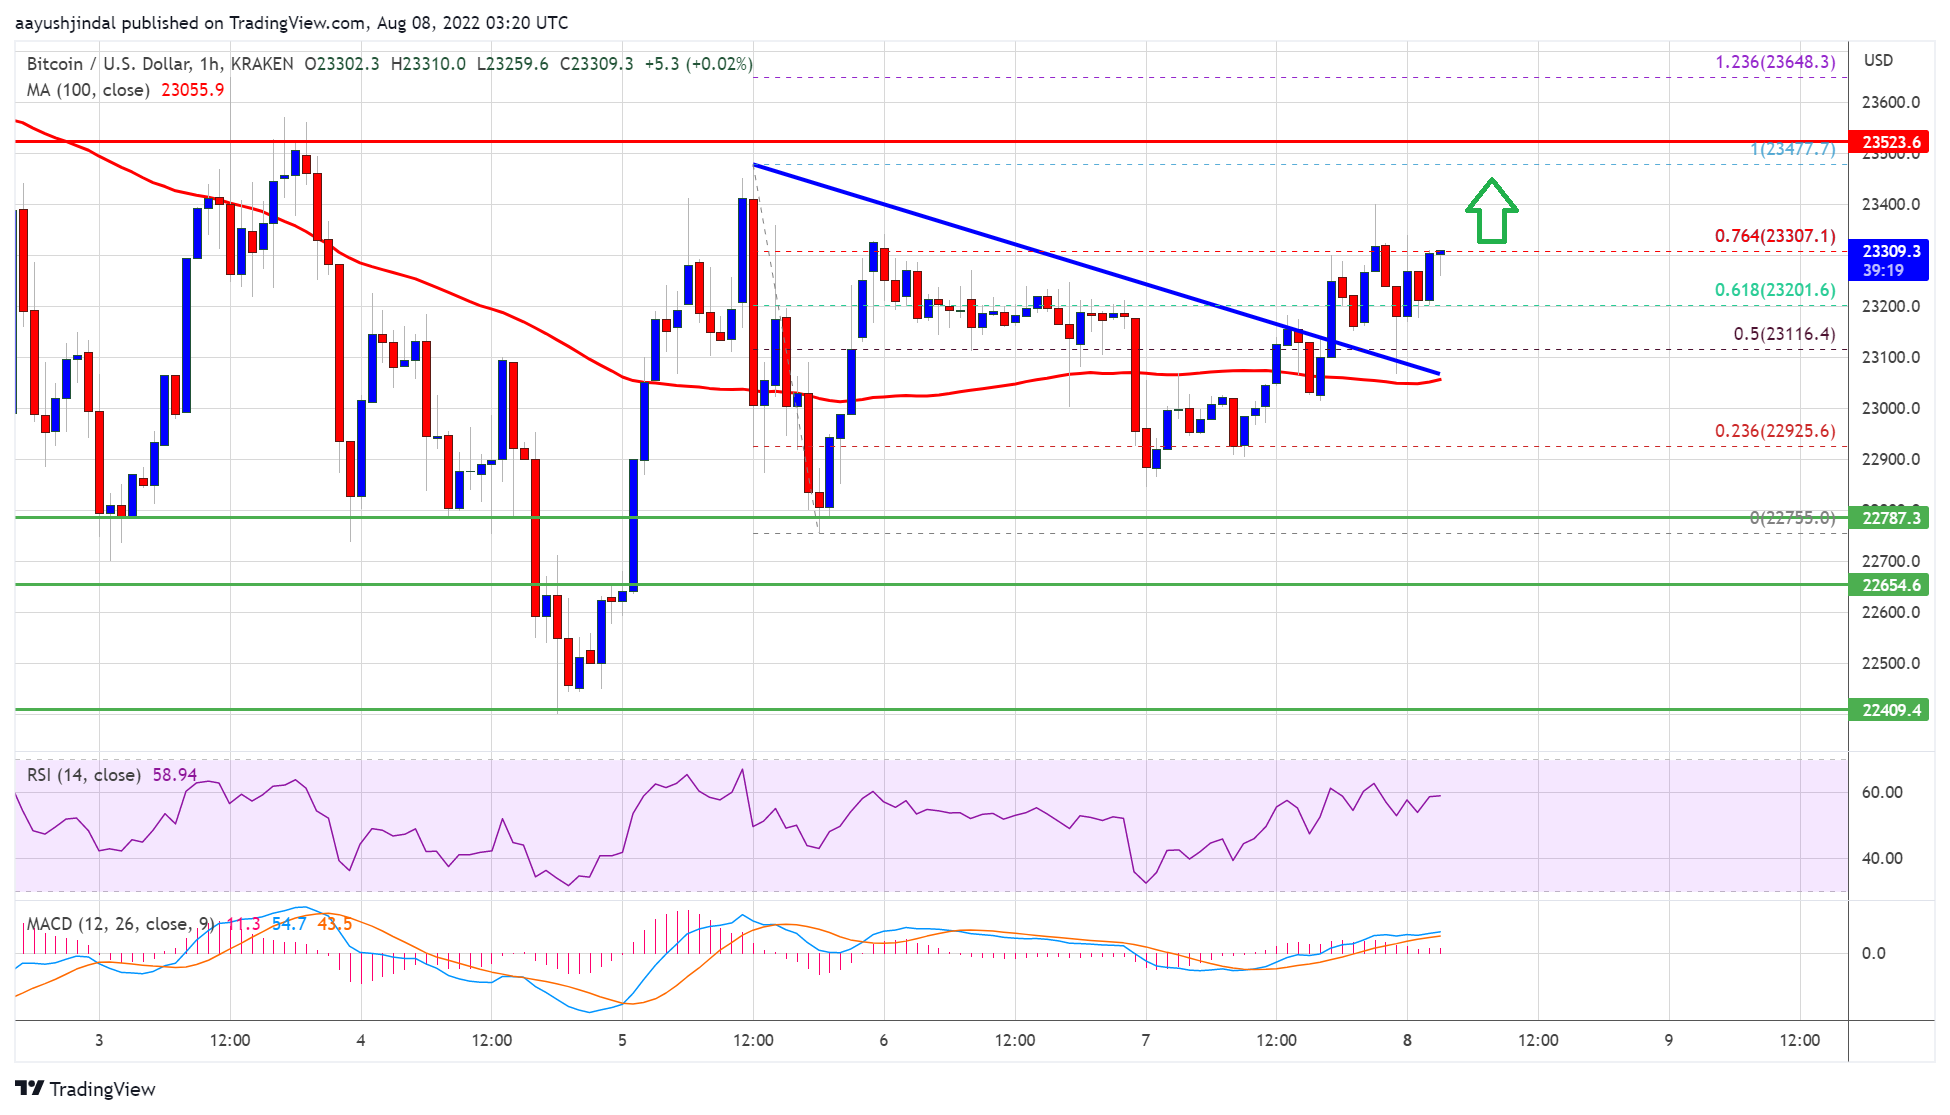
Bitcoin price remained supported above the $22,650 level against the US Dollar. BTC could rally if there is a clear move above the $23,500 resistance zone.
Bitcoin is trading in a range above the $22,500 level the $23,500 level.
The price is now trading above the $23,000 level and the 100 hourly simple moving average.
There was a break above a key bearish trend line with resistance near $23,200 on the hourly chart of the BTC/USD pair (data feed from Kraken).
The pair must clear the $23,500 resistance to start a steady increase in the near term.
Bitcoin Price Faces Key Barrier
Bitcoin price remained above a major support zone near the $22,400 and $22,500 levels. The price started a decent increase above the $22,800 and $22,950 levels.
The upward move was such that the price climbed above the $23,000 level and the 100 hourly simple moving average. The price surpassed the 50% Fib retracement level of the downward move from the $23,477 swing high to $22,755 low.
Besides, there was a break above a key bearish trend line with resistance near $23,200 on the hourly chart of the BTC/USD pair. The pair is now trading near the $23,300 level.
Source: BTCUSD on TradingView.com
It is struggling near the 76.4% Fib retracement level of the downward move from the $23,477 swing high to $22,755 low. The next key resistance is near the $23,500 zone. A close above the $23,500 resistance zone could start a steady increase. In the stated case, the price may perhaps rise clear the $24,500 resistance.
Downside Break in BTC?
If bitcoin fails to clear the $23,500 resistance zone, it could start a downside correction. An immediate support on the downside is near the $23,100 level.
The next major support now sits near the $22,750 level. A close below the $22,750 level might start a move towards $22,500. Any more losses might send the price towards $22,000 level.
Technical indicators:
Hourly MACD – The MACD is now gaining pace in the bullish zone.
Hourly RSI (Relative Strength Index) – The RSI for BTC/USD is now above the 50 level.
Major Support Levels – $23,100, followed by $22,750.
Major Resistance Levels – $23,500, $24,200 and $24,500.
Bitcoin price remained supported above the $22,650 level against the US Dollar. BTC could rally if there is a clear move above the $23,500 resistance zone.
Bitcoin is trading in a range above the $22,500 level the $23,500 level.
The price is now trading above the $23,000 level and the 100 hourly simple moving average.
There was a break above a key bearish trend line with resistance near $23,200 on the hourly chart of the BTC/USD pair (data feed from Kraken).
The pair must clear the $23,500 resistance to start a steady increase in the near term.
Bitcoin price remained above a major support zone near the $22,400 and $22,500 levels. The price started a decent increase above the $22,800 and $22,950 levels.
The upward move was such that the price climbed above the $23,000 level and the 100 hourly simple moving average. The price surpassed the 50% Fib retracement level of the downward move from the $23,477 swing high to $22,755 low.
Besides, there was a break above a key bearish trend line with resistance near $23,200 on the hourly chart of the BTC/USD pair. The pair is now trading near the $23,300 level.
Source: BTCUSD on TradingView.com
It is struggling near the 76.4% Fib retracement level of the downward move from the $23,477 swing high to $22,755 low. The next key resistance is near the $23,500 zone. A close above the $23,500 resistance zone could start a steady increase. In the stated case, the price may perhaps rise clear the $24,500 resistance.
If bitcoin fails to clear the $23,500 resistance zone, it could start a downside correction. An immediate support on the downside is near the $23,100 level.
The next major support now sits near the $22,750 level. A close below the $22,750 level might start a move towards $22,500. Any more losses might send the price towards $22,000 level.
Technical indicators:
Hourly MACD – The MACD is now gaining pace in the bullish zone.
Hourly RSI (Relative Strength Index) – The RSI for BTC/USD is now above the 50 level.
Major Support Levels – $23,100, followed by $22,750.
Major Resistance Levels – $23,500, $24,200 and $24,500.
Tags: bitcoinbtcusdBTCUSDTxbtusd
NewsBTCRead More
Data shows the Bitcoin perpetual futures market has seen a negative Funding Rate recently, suggesting…
Despite the crypto market’s renewed weakness on Thursday, a new AI-driven market model produced by…
The recent price action echoes the November–January pattern, showing weak conviction among the “buy the…
Morgan Stanley has filed to launch a spot Bitcoin ETF with the ticker MSBT and…
Oil prices slipped as major economies announced joint efforts to stabilize energy markets.Read MoreCoinDesk: Bitcoin,…
BTQ Technologies moved a key Bitcoin (BTC) security proposal from theory to practice on Thursday,…