Bitcoin started a downside correction from the $24,000 resistance against the US Dollar. BTC is finding bids near $22,500 and might start a fresh increase.
Bitcoin started a downside correction and traded below the $23,000 level.
The price is now trading above the $22,000 level and testing the 100 hourly simple moving average.
There was a break above a key bearish trend line with resistance near $22,750 on the hourly chart of the BTC/USD pair (data feed from Kraken).
The pair might continue to rise if it stays above $22,500 and the 100 hourly SMA.
Bitcoin Price Remains Supported
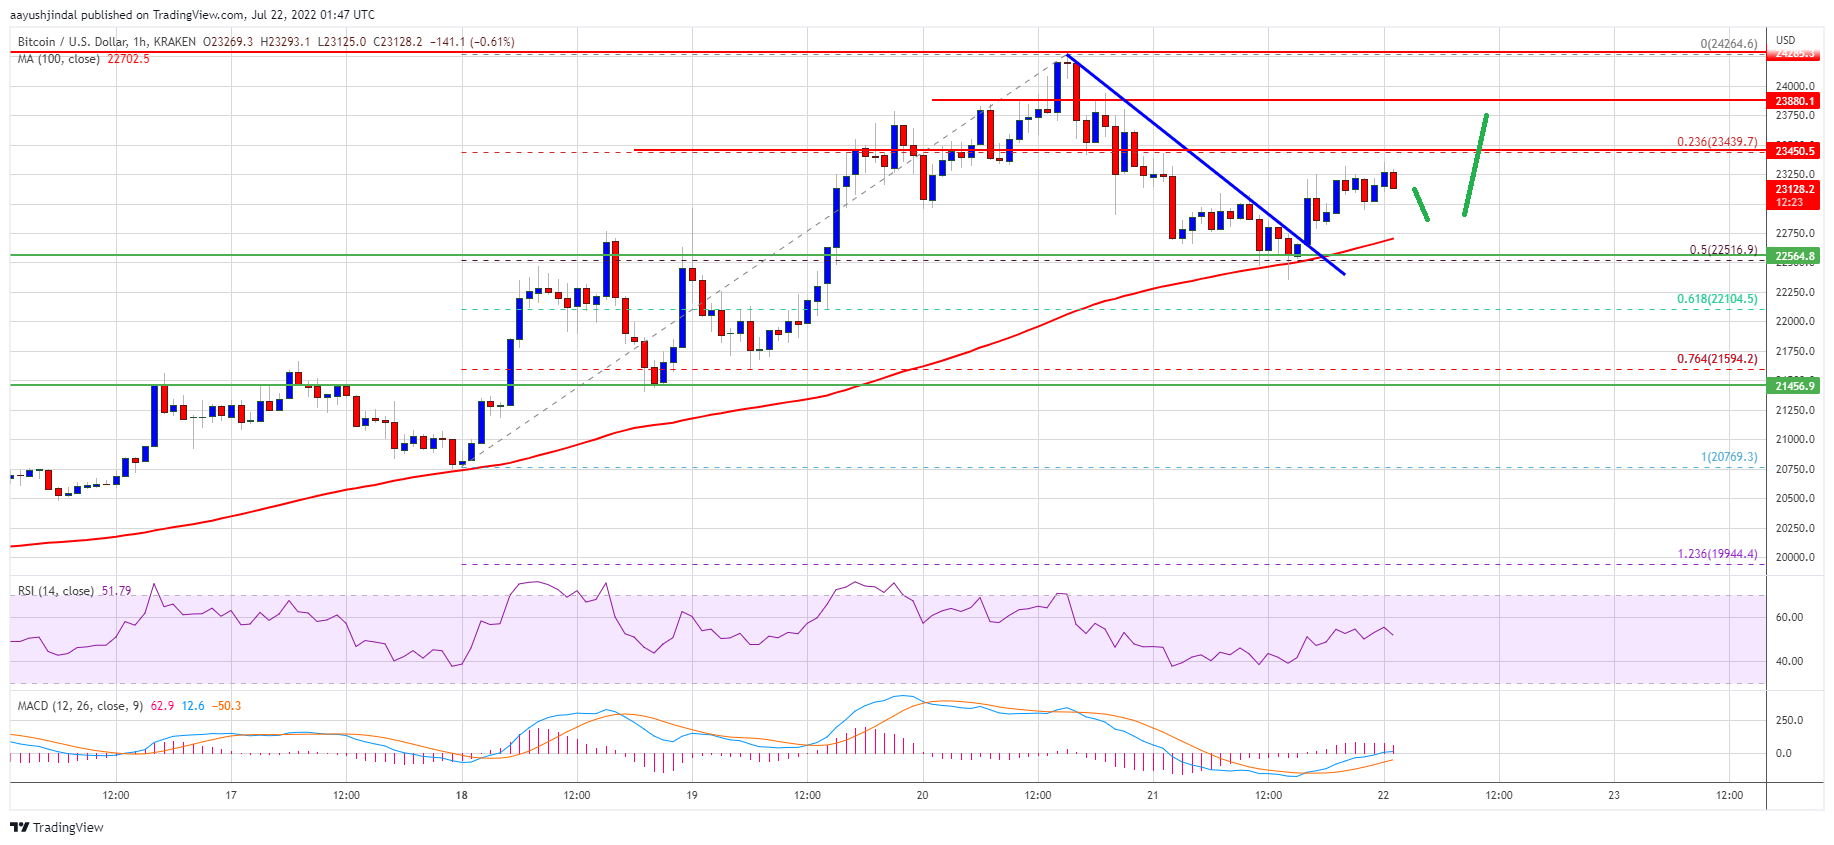
Bitcoin price gained pace and spiked above the $24,000 resistance zone. However, the bears appeared near $24,250. A high was formed near $24,264 and the price started a downside correction.
There was a move below the $24,000 and $23,500 levels. The price declined below the 38.2% Fib retracement level of the upward move from the $20,769 swing low to $24,264 high. Besides, there was a spike below the $23,000 level.
Bitcoin found support near the $22,500 zone and the 100 hourly simple moving average. It started a decent upward move and climbed above $23,000.
There was a break above a key bearish trend line with resistance near $22,750 on the hourly chart of the BTC/USD pair. On the upside, bitcoin price could face resistance near the $23,440 level. The next key resistance is near the $23,880 zone.
Source: BTCUSD on TradingView.com
A close above the $23,880 resistance zone could set the pace for more gains. In the stated case, the price may perhaps rise towards the $24,250 level. The next major resistance sits near the $25,000 level.
Downside Break in BTC?
If bitcoin fails to clear the $23,880 resistance zone, it could start a downside correction. An immediate support on the downside is near the $22,750 level and the 100 hourly SMA.
The next major support now sits near the $22,500 level. A clear break and close below the $22,500 support zone might send the price towards $21,450 in the near term or even $21,000.
Technical indicators:
Hourly MACD – The MACD is now losing pace in the bullish zone.
Hourly RSI (Relative Strength Index) – The RSI for BTC/USD is still above the 50 level.
Major Support Levels – $22,750, followed by $22,500.
Major Resistance Levels – $23,440, $23,880 and $24,250.
Bitcoin started a downside correction from the $24,000 resistance against the US Dollar. BTC is finding bids near $22,500 and might start a fresh increase.
Bitcoin started a downside correction and traded below the $23,000 level.
The price is now trading above the $22,000 level and testing the 100 hourly simple moving average.
There was a break above a key bearish trend line with resistance near $22,750 on the hourly chart of the BTC/USD pair (data feed from Kraken).
The pair might continue to rise if it stays above $22,500 and the 100 hourly SMA.
Bitcoin price gained pace and spiked above the $24,000 resistance zone. However, the bears appeared near $24,250. A high was formed near $24,264 and the price started a downside correction.
There was a move below the $24,000 and $23,500 levels. The price declined below the 38.2% Fib retracement level of the upward move from the $20,769 swing low to $24,264 high. Besides, there was a spike below the $23,000 level.
Bitcoin found support near the $22,500 zone and the 100 hourly simple moving average. It started a decent upward move and climbed above $23,000.
There was a break above a key bearish trend line with resistance near $22,750 on the hourly chart of the BTC/USD pair. On the upside, bitcoin price could face resistance near the $23,440 level. The next key resistance is near the $23,880 zone.
Source: BTCUSD on TradingView.com
A close above the $23,880 resistance zone could set the pace for more gains. In the stated case, the price may perhaps rise towards the $24,250 level. The next major resistance sits near the $25,000 level.
If bitcoin fails to clear the $23,880 resistance zone, it could start a downside correction. An immediate support on the downside is near the $22,750 level and the 100 hourly SMA.
The next major support now sits near the $22,500 level. A clear break and close below the $22,500 support zone might send the price towards $21,450 in the near term or even $21,000.
Technical indicators:
Hourly MACD – The MACD is now losing pace in the bullish zone.
Hourly RSI (Relative Strength Index) – The RSI for BTC/USD is still above the 50 level.
Major Support Levels – $22,750, followed by $22,500.
Major Resistance Levels – $23,440, $23,880 and $24,250.
Tags: bitcoinbtcusdBTCUSDTxbtusd
FeedzyRead More
The company's stack now stands at 761,068 bitcoin, acquired for $57.61 billion.Read MoreCoinDesk: Bitcoin, Ethereum,…
The Japanese bitcoin treasury firm structured the financing with premium-priced shares and warrants that could…
At the time of writing, Bitcoin (BTC) trades in the highs $73,000, outperforming both equities…
Bitcoin Magazine Strategy (MSTR) Spends $1.57 Billion to Buy 22,337 More Bitcoin, Holdings Reach 738,731…
Your day-ahead look for March 16, 2026Read MoreCoinDesk: Bitcoin, Ethereum, Crypto News and Price Data[#item_full_content]
The Bitcoin and Ethereum prices continue to struggle, with BTC dropping to as low as…