Bitcoin is consolidating near the $20,000 zone against the US Dollar. BTC could start a decent recovery wave if it clears the $20,550 resistance zone.
Bitcoin is showing a few positive signs above the $20,000 resistance.
The price is now trading above the $20,000 level and the 100 hourly simple moving average.
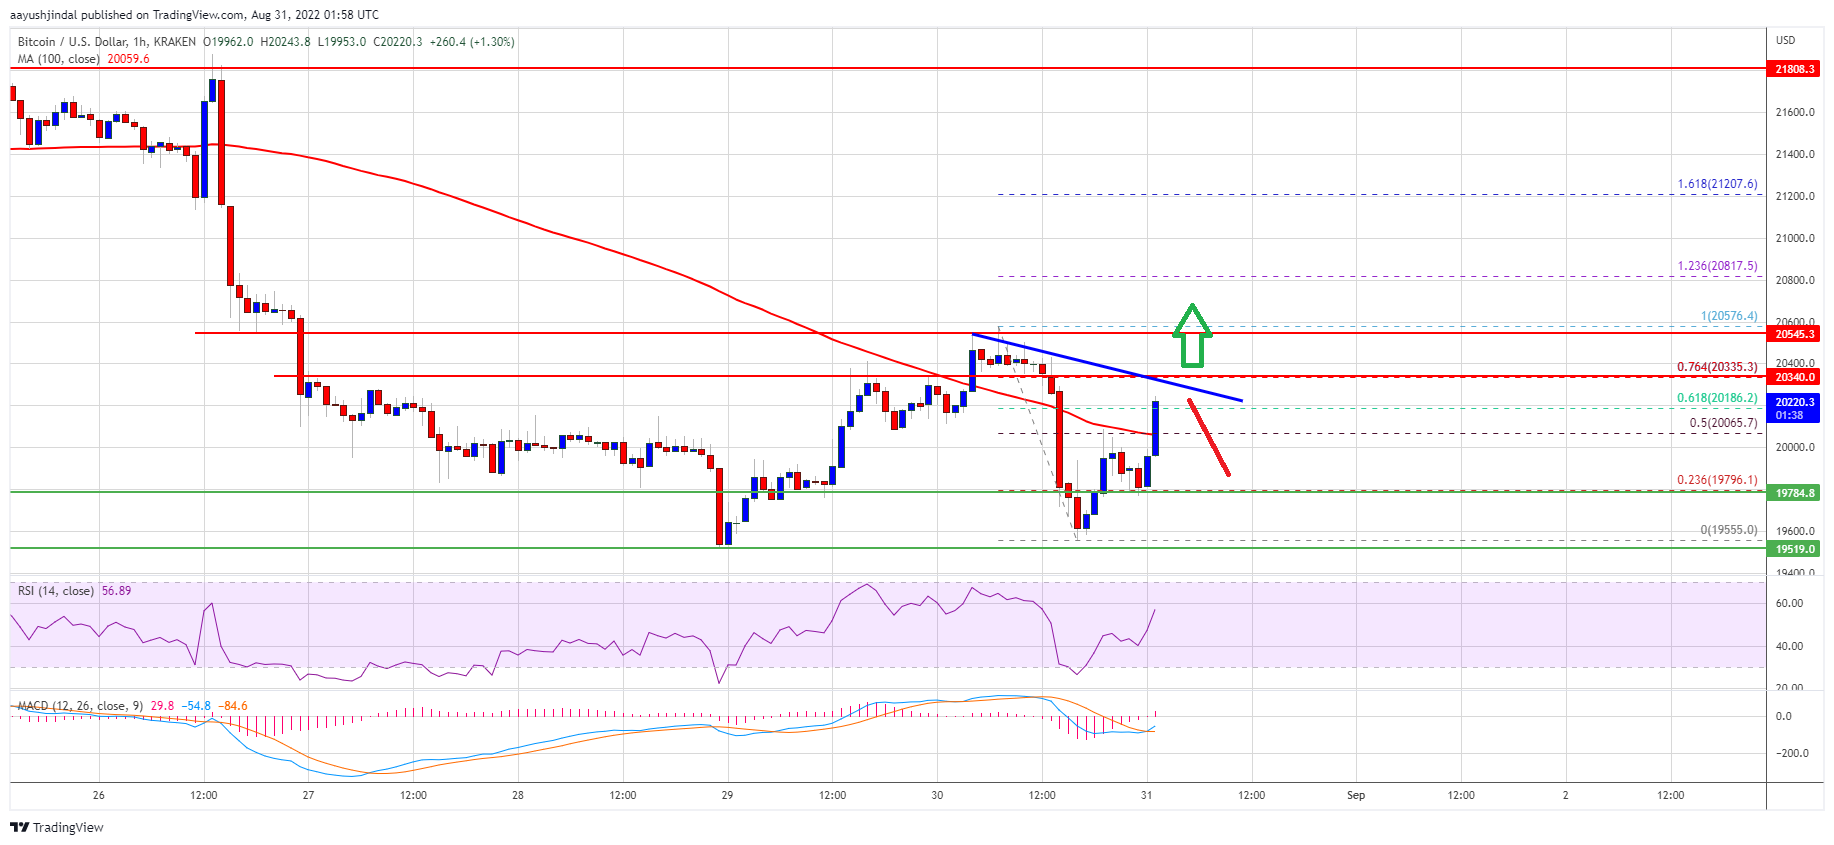
There is a connecting bearish trend line forming with resistance near $20,340 on the hourly chart of the BTC/USD pair (data feed from Kraken).
The pair must clear the $20,340 zone and $20,550 to start a steady increase.
Bitcoin Price Struggles
Bitcoin price started a minor upside correction above the $20,000 resistance zone. BTC even cleared the $20,200 resistance zone and the 100 hourly simple moving average.
It spiked above the $20,500 level but the bulls struggled to push the price further higher. A high was formed near $20,576 before there was a bearish reaction. The price declined sharply below the $20,000 level and the 100 hourly simple moving average.
However, it stayed above the $19,500 support zone. A low is formed near $19,555 and the price is now rising. There was a move above the 50% Fib retracement level of the recent decline from the $20,576 swing high to $19,555 low.
Bitcoin is now trading above the $20,000 level and the 100 hourly simple moving average. On the upside, an immediate resistance is near the $20,340 level.
There is also a connecting bearish trend line forming with resistance near $20,340 on the hourly chart of the BTC/USD pair. The trend line is near the 76.4% Fib retracement level of the recent decline from the $20,576 swing high to $19,555 low.
Source: BTCUSD on TradingView.com
The next major resistance sits near the $20,550 level. A clear move above the $20,550 resistance might send the price towards $21,000. Any more gains might send the price towards the $22,000 resistance zone.
Fresh Decline in BTC?
If bitcoin fails to clear the $20,550 resistance zone, it could start another decline. An immediate support on the downside is near the $20,000 zone.
The next major support sits near the $19,780 level. A break below the $19,780 support might push the price to $19,550. Any more losses might call for a new low below $19,500.
Technical indicators:
Hourly MACD – The MACD is now gaining pace in the bullish zone.
Hourly RSI (Relative Strength Index) – The RSI for BTC/USD is now above the 50 level.
Major Support Levels – $19,780, followed by $19,500.
Major Resistance Levels – $20,340, $20,550 and $21,000.
Bitcoin is consolidating near the $20,000 zone against the US Dollar. BTC could start a decent recovery wave if it clears the $20,550 resistance zone.
Bitcoin is showing a few positive signs above the $20,000 resistance.
The price is now trading above the $20,000 level and the 100 hourly simple moving average.
There is a connecting bearish trend line forming with resistance near $20,340 on the hourly chart of the BTC/USD pair (data feed from Kraken).
The pair must clear the $20,340 zone and $20,550 to start a steady increase.
Bitcoin price started a minor upside correction above the $20,000 resistance zone. BTC even cleared the $20,200 resistance zone and the 100 hourly simple moving average.
It spiked above the $20,500 level but the bulls struggled to push the price further higher. A high was formed near $20,576 before there was a bearish reaction. The price declined sharply below the $20,000 level and the 100 hourly simple moving average.
However, it stayed above the $19,500 support zone. A low is formed near $19,555 and the price is now rising. There was a move above the 50% Fib retracement level of the recent decline from the $20,576 swing high to $19,555 low.
Bitcoin is now trading above the $20,000 level and the 100 hourly simple moving average. On the upside, an immediate resistance is near the $20,340 level.
There is also a connecting bearish trend line forming with resistance near $20,340 on the hourly chart of the BTC/USD pair. The trend line is near the 76.4% Fib retracement level of the recent decline from the $20,576 swing high to $19,555 low.
Source: BTCUSD on TradingView.com
The next major resistance sits near the $20,550 level. A clear move above the $20,550 resistance might send the price towards $21,000. Any more gains might send the price towards the $22,000 resistance zone.
If bitcoin fails to clear the $20,550 resistance zone, it could start another decline. An immediate support on the downside is near the $20,000 zone.
The next major support sits near the $19,780 level. A break below the $19,780 support might push the price to $19,550. Any more losses might call for a new low below $19,500.
Technical indicators:
Hourly MACD – The MACD is now gaining pace in the bullish zone.
Hourly RSI (Relative Strength Index) – The RSI for BTC/USD is now above the 50 level.
Major Support Levels – $19,780, followed by $19,500.
Major Resistance Levels – $20,340, $20,550 and $21,000.
Tags: bitcoinbtcusdBTCUSDTxbtusd
NewsBTCRead More
Bitcoin Magazine US Hoovers up Bitcoin While the World Runs on Its Digital Dollars: Report…
Bitcoin Magazine Bitcoin Briefly Slides Below $80,000 On More Hot Inflation Data Bitcoin’s price momentarily…
Bitcoin Magazine Troy Cross: Number Go Up – The Solution to Bitcoin’s Marketing Problem? Can…
Bitcoin Magazine Wellington-Altus’ James Thorne: Bitcoin “Supercycle” has Begun “The next run in Bitcoin is…
Bitcoin Magazine Charles Edwards: Why Quantum Risk Could Be MASSIVE BTC Upside Catalyst What will…
Bitcoin Magazine Latin America’s MSTR: How OranjeBTC is Running the Saylor Playbook in Brazil |…