Bitcoin extended losses below the $21,000 support against the US Dollar. BTC is consolidating and any upsides might face hurdles near $21,500.
Bitcoin remained in a bearish zone and traded below the $21,000 level.
The price is now trading below the $21,500 level and the 100 hourly simple moving average.
There is a key bearish trend line forming with resistance near $21,650 on the hourly chart of the BTC/USD pair (data feed from Kraken).
The pair might correct higher but upsides might be limited above $21,500.
Bitcoin Price Remains In A Bearish Zone
Bitcoin price remained in a bearish zone after it settled below the $22,000 support zone. It consolidated near the $21,000 zone for some time before there were more losses.
The price declined below the $21,000 level but downsides were limited. A low is formed near $20,750 and the price is now consolidating losses. It is now trading below the $21,500 level and the 100 hourly simple moving average.
There was a minor upside above the $21,000 level. The price cleared the 23.6% Fib retracement level of the recent drop from the $22,250 swing high to $20,750 low.
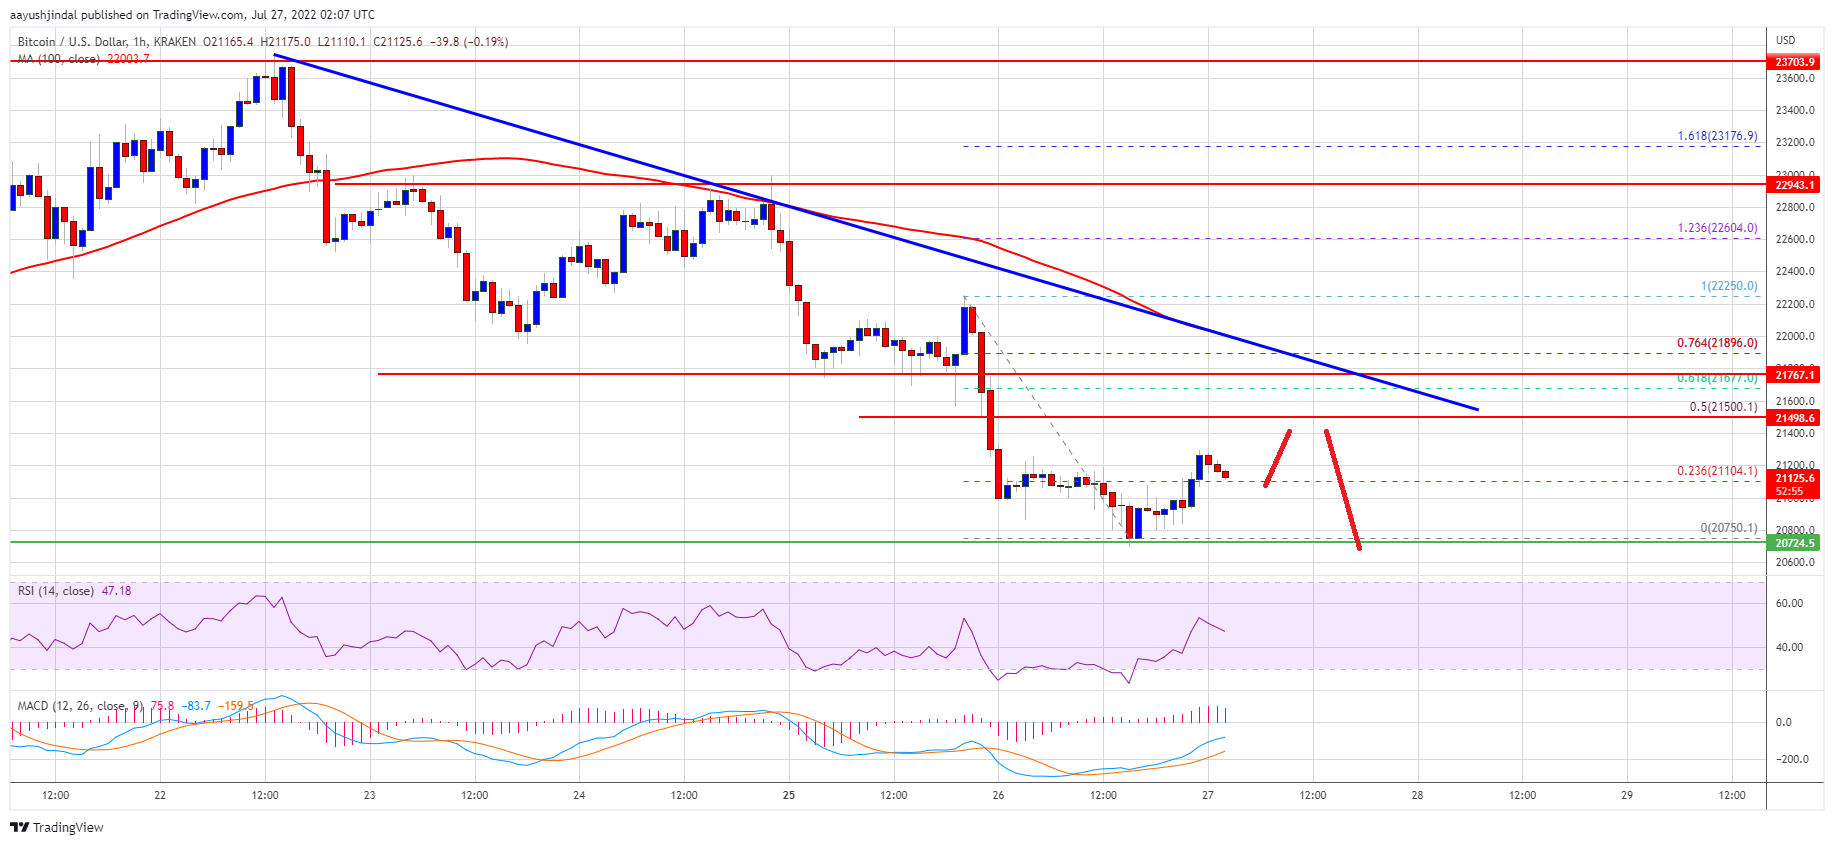
On the upside, bitcoin price could face resistance near the $21,500 level. It is near the 50% Fib retracement level of the recent drop from the $22,250 swing high to $20,750 low. The next key resistance is near the $21,650 zone. There is also a key bearish trend line forming with resistance near $21,650 on the hourly chart of the BTC/USD pair.
Source: BTCUSD on TradingView.com
A close above the $21,650 resistance zone could set the pace for a decent increase. In the stated case, the price may perhaps rise towards the $22,000 level. The next major resistance sits near the $22,500 level.
More Losses in BTC?
If bitcoin fails to start a recovery wave above the $21,500 level, it could continue to move down. An immediate support on the downside is near the $21,000 level.
The next major support now sits near the $20,750 and $20,500 levels. A close below the $20,500 support zone might increase selling pressure and the price might test $20,000 in the near term.
Technical indicators:
Hourly MACD – The MACD is now losing pace in the bearish zone.
Hourly RSI (Relative Strength Index) – The RSI for BTC/USD is now near the 50 level.
Major Support Levels – $21,000, followed by $20,750.
Major Resistance Levels – $21,500, $21,650 and $22,000.
Bitcoin extended losses below the $21,000 support against the US Dollar. BTC is consolidating and any upsides might face hurdles near $21,500.
Bitcoin remained in a bearish zone and traded below the $21,000 level.
The price is now trading below the $21,500 level and the 100 hourly simple moving average.
There is a key bearish trend line forming with resistance near $21,650 on the hourly chart of the BTC/USD pair (data feed from Kraken).
The pair might correct higher but upsides might be limited above $21,500.
Bitcoin price remained in a bearish zone after it settled below the $22,000 support zone. It consolidated near the $21,000 zone for some time before there were more losses.
The price declined below the $21,000 level but downsides were limited. A low is formed near $20,750 and the price is now consolidating losses. It is now trading below the $21,500 level and the 100 hourly simple moving average.
There was a minor upside above the $21,000 level. The price cleared the 23.6% Fib retracement level of the recent drop from the $22,250 swing high to $20,750 low.
On the upside, bitcoin price could face resistance near the $21,500 level. It is near the 50% Fib retracement level of the recent drop from the $22,250 swing high to $20,750 low. The next key resistance is near the $21,650 zone. There is also a key bearish trend line forming with resistance near $21,650 on the hourly chart of the BTC/USD pair.
Source: BTCUSD on TradingView.com
A close above the $21,650 resistance zone could set the pace for a decent increase. In the stated case, the price may perhaps rise towards the $22,000 level. The next major resistance sits near the $22,500 level.
If bitcoin fails to start a recovery wave above the $21,500 level, it could continue to move down. An immediate support on the downside is near the $21,000 level.
The next major support now sits near the $20,750 and $20,500 levels. A close below the $20,500 support zone might increase selling pressure and the price might test $20,000 in the near term.
Technical indicators:
Hourly MACD – The MACD is now losing pace in the bearish zone.
Hourly RSI (Relative Strength Index) – The RSI for BTC/USD is now near the 50 level.
Major Support Levels – $21,000, followed by $20,750.
Major Resistance Levels – $21,500, $21,650 and $22,000.
Tags: bitcoinbtcusdBTCUSDTxbtusd
FeedzyRead More
Solana tumbled below $120 to its weakest price since April, while SUI, DOGE and ADA…
Bitcoin Magazine SEC Charges Bitcoin Miner for Duping Investors Out of $48.5 Million The U.S.…
Crypto markets swung sharply Thursday following a softer-than-expected U.S. CPI print, which briefly lifted bitcoin…
Bitcoin Magazine Bitcoin Price Crashes to $84,000 – Is $70,000 Next? The bitcoin price dropped…
Bitcoin Magazine Fold Launches Nationwide Bitcoin Services Across All 50 States With BitGo Fold Holdings,…
A very supportive macro backdrop is being ignored for now, said Bitwise's Andre Dragosch.Read MoreCoinDesk:…