Bitcoin started a downside correction from $44,500 against the US Dollar. BTC is stable above $42,800 and the bulls might aim a fresh increase above $43,500.
Bitcoin is trading in a positive zone above $42,500 and $42,800.
The price is trading below $43,500 and the 100 hourly simple moving average.
There is a key contracting triangle forming with resistance near $43,200 on the hourly chart of the BTC/USD pair (data feed from Kraken).
The pair could start a major increase if there is a clear move above the $43,500 resistance.
Bitcoin Price Is Holding Support
Bitcoin price extended increase above the $44,000 resistance zone. BTC even spiked above the $44,200 level before it faced sellers.
A high was formed near $44,400 and the price started a fresh decline. There was a clear move below the $43,500 and $43,200 levels. The price even dived below the $42,500 support and a close below the 100 hourly simple moving average.
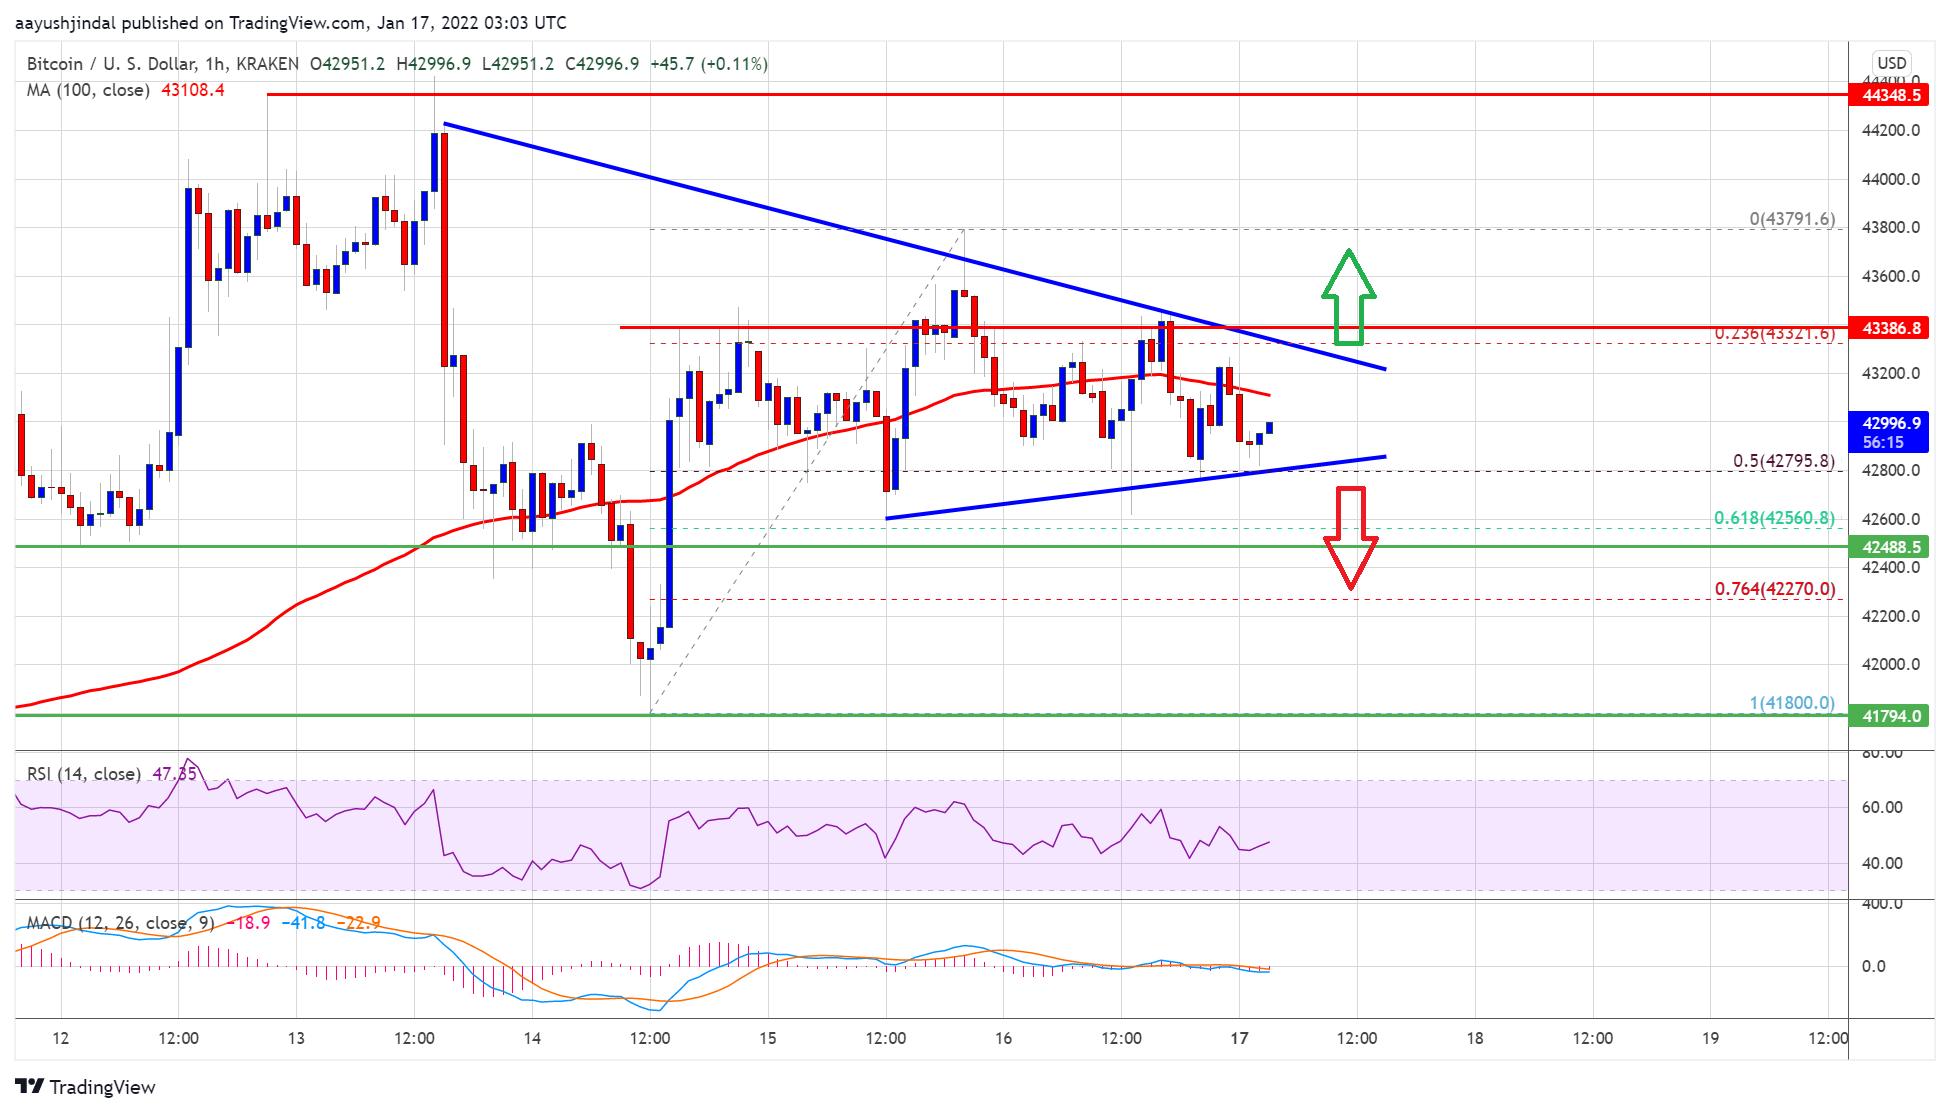
A low was formed near $41,800 before the price started an upside correction. It traded as high as $43,791 and is currently consolidating. Bitcoin price is trading below $43,500 and the 100 hourly simple moving average.
An immediate support is near the 50% Fib retracement level of the recent increase from the $41,800 swing low to $43,791 high. Besides, there is a key contracting triangle forming with resistance near $43,200 on the hourly chart of the BTC/USD pair.
Source: BTCUSD on TradingView.com
On the upside, an initial resistance is near the $43,200 level. The next major resistance is near the $43,500 level. A clear move above the $43,500 level might send the price towards the $44,000 resistance. Any more gains may perhaps call for a test of the $44,200 resistance zone. The next major resistance is near the $45,000 level.
Fresh Decline in BTC?
If bitcoin fails to start a fresh increase above $43,500, it could start a fresh decline. An immediate support on the downside is near the $42,800 zone.
The first major support is seen near the $42,500 zone. It is near the 61.8% Fib retracement level of the recent increase from the $41,800 swing low to $43,791 high. A downside break below the $42,500 support zone could lead the price towards the $41,800 level.
Technical indicators:
Hourly MACD – The MACD is slowly losing pace in the bearish zone.
Hourly RSI (Relative Strength Index) – The RSI for BTC/USD is near the 50 level.
Major Support Levels – $42,800, followed by $42,500.
Major Resistance Levels – $43,200, $43,500 and $44,200.
Bitcoin started a downside correction from $44,500 against the US Dollar. BTC is stable above $42,800 and the bulls might aim a fresh increase above $43,500.
Bitcoin is trading in a positive zone above $42,500 and $42,800.
The price is trading below $43,500 and the 100 hourly simple moving average.
There is a key contracting triangle forming with resistance near $43,200 on the hourly chart of the BTC/USD pair (data feed from Kraken).
The pair could start a major increase if there is a clear move above the $43,500 resistance.
Bitcoin price extended increase above the $44,000 resistance zone. BTC even spiked above the $44,200 level before it faced sellers.
A high was formed near $44,400 and the price started a fresh decline. There was a clear move below the $43,500 and $43,200 levels. The price even dived below the $42,500 support and a close below the 100 hourly simple moving average.
A low was formed near $41,800 before the price started an upside correction. It traded as high as $43,791 and is currently consolidating. Bitcoin price is trading below $43,500 and the 100 hourly simple moving average.
An immediate support is near the 50% Fib retracement level of the recent increase from the $41,800 swing low to $43,791 high. Besides, there is a key contracting triangle forming with resistance near $43,200 on the hourly chart of the BTC/USD pair.
Source: BTCUSD on TradingView.com
On the upside, an initial resistance is near the $43,200 level. The next major resistance is near the $43,500 level. A clear move above the $43,500 level might send the price towards the $44,000 resistance. Any more gains may perhaps call for a test of the $44,200 resistance zone. The next major resistance is near the $45,000 level.
If bitcoin fails to start a fresh increase above $43,500, it could start a fresh decline. An immediate support on the downside is near the $42,800 zone.
The first major support is seen near the $42,500 zone. It is near the 61.8% Fib retracement level of the recent increase from the $41,800 swing low to $43,791 high. A downside break below the $42,500 support zone could lead the price towards the $41,800 level.
Technical indicators:
Hourly MACD – The MACD is slowly losing pace in the bearish zone.
Hourly RSI (Relative Strength Index) – The RSI for BTC/USD is near the 50 level.
Major Support Levels – $42,800, followed by $42,500.
Major Resistance Levels – $43,200, $43,500 and $44,200.
Tags: bitcoinbtcusdBTCUSDTxbtusd
FeedzyRead More
Bitcoin has long been lumped in with precious metals as a hedge against a weakening…
TL;DR On-chain records in the supplied pack point to a trader opening high-leverage short exposure…
TL;DR Ripple CEO Brad Garlinghouse criticized Michael Saylor’s Bitcoin accumulation model, according to reports from…
TL;DR Ripple CEO Brad Garlinghouse criticized Michael Saylor’s Bitcoin accumulation model, according to reports from…
TL;DR The supplied setup highlights resistance near the $61,000 area and support/liquidation interest around $58,200.Bitcoin…
TL;DR Mysten Labs’ Hashi framework aims to bring native Bitcoin collateral into Sui DeFi without…