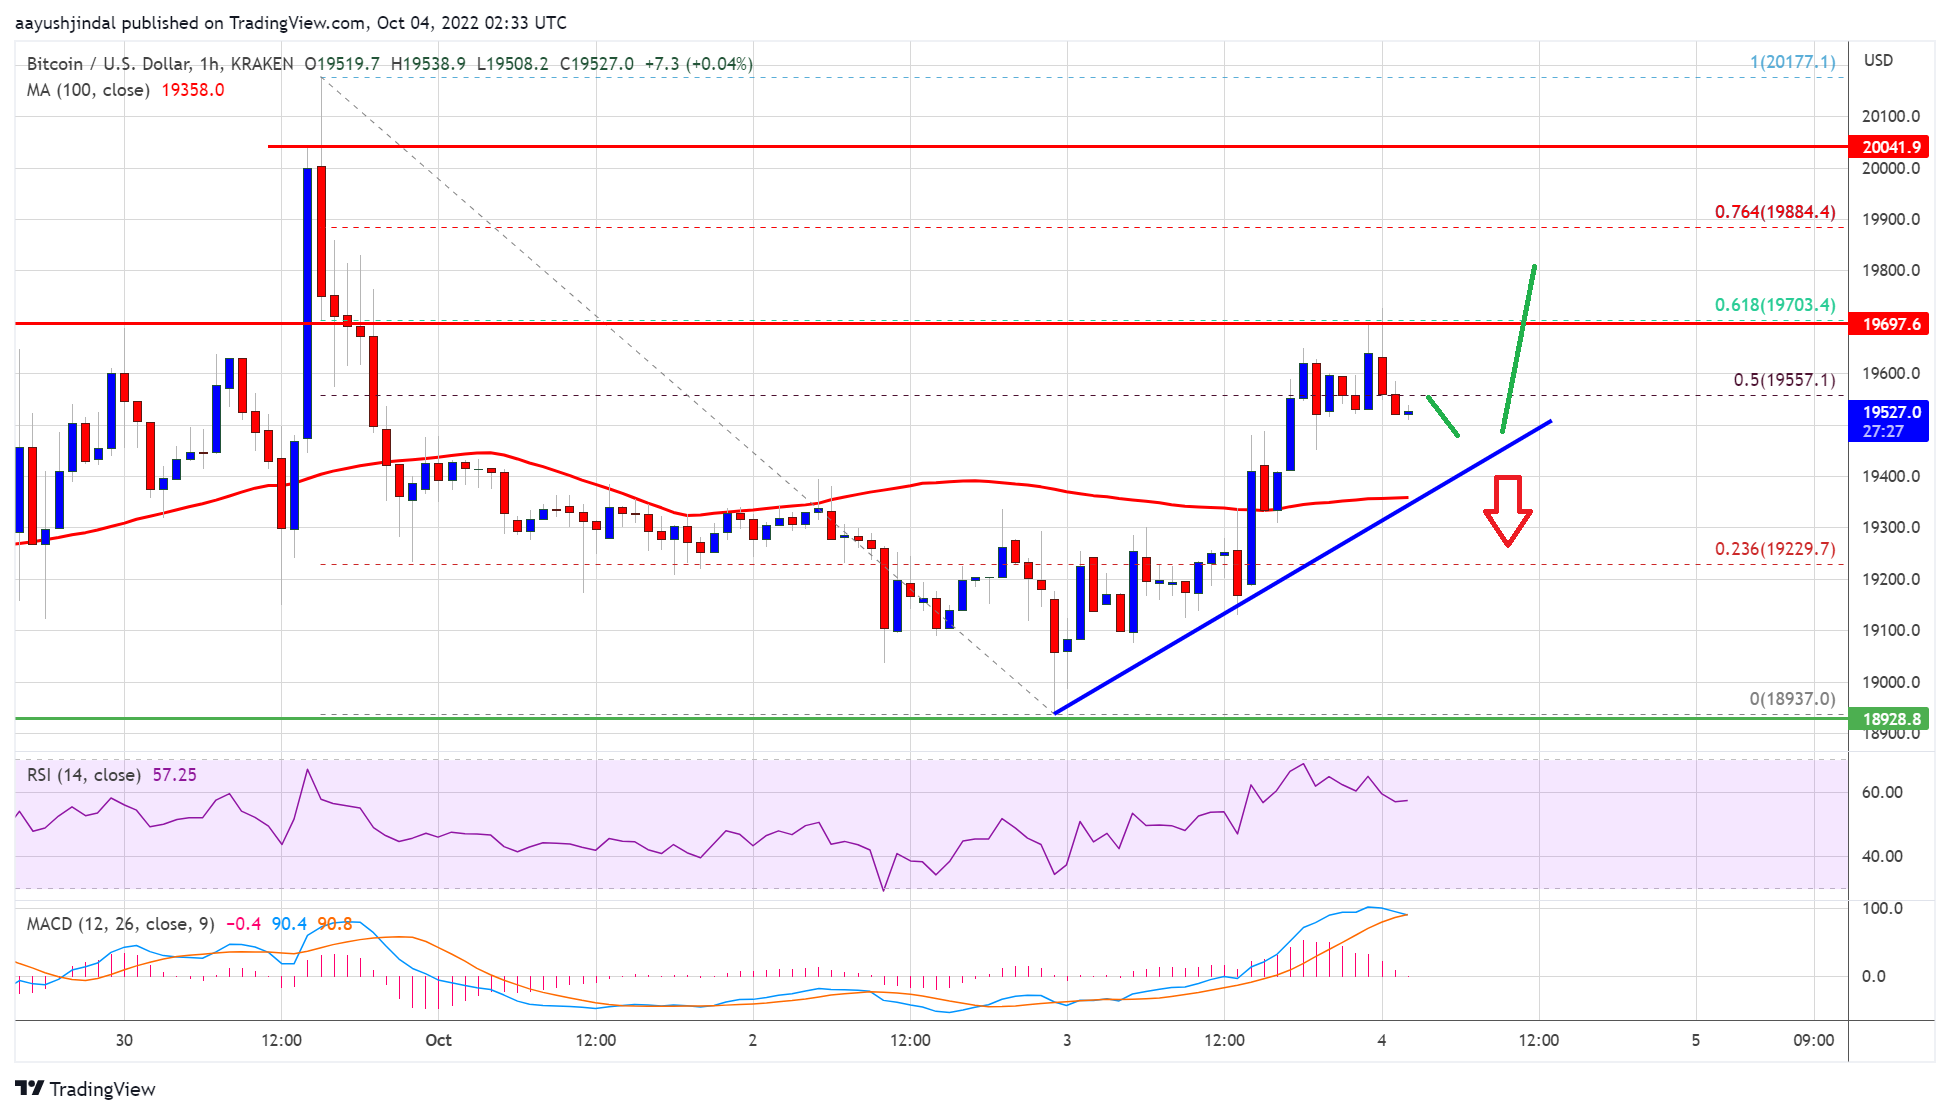
Bitcoin price is slowly moving higher above $19,500 against the US Dollar. BTC could start a steady increase if there is a close above $19,600 and $20,000.
Bitcoin remained well bid above the $19,200 and $19,000 support levels.
The price is trading above $19,400 and the 100 hourly simple moving average.
There is a key bullish trend line forming with support near $19,450 on the hourly chart of the BTC/USD pair (data feed from Kraken).
The pair could start a steady increase if there is a clear move above the $19,700 level.
Bitcoin Price Eyes Steady Increase
Bitcoin price remained strong above the $19,000 level. BTC traded as low as $18,937 and started a steady increase. There was a move above the $19,150 and $19200 levels.
The price was able to clear the 50% Fib retracement level of the downward move from the $20,177 swing high to $18,937 low. There was a also a move above the $19,500 resistance zone to move into a short-term positive zone.
Bitcoin price is now trading above $19,400 and the 100 hourly simple moving average. There is also a key bullish trend line forming with support near $19,450 on the hourly chart of the BTC/USD pair.
On the upside, an immediate resistance is near the $19,700 level. It is near the 61.8% Fib retracement level of the downward move from the $20,177 swing high to $18,937 low. The next major resistance sits near the $20,000 zone.
Source: BTCUSD on TradingView.com
A clear move above the $20,0000 resistance might start a fresh increase. In the stated case, the price could even surpass the $20,200 resistance zone. The next major resistance is near the $20,500 zone.
Another Decline in BTC?
If bitcoin fails to rise above the $19,700 resistance zone, it could start a fresh decline. An immediate support on the downside is near the $19,400 zone.
The next major support is near the $19,000 zone. The main support is near $18,500, below which there could be a major decline. In the stated case, the price may perhaps decline towards the $17,500 support.
Technical indicators:
Hourly MACD – The MACD is now gaining pace in the bullish zone.
Hourly RSI (Relative Strength Index) – The RSI for BTC/USD is now above the 50 level.
Major Support Levels – $19,400, followed by $19,200.
Major Resistance Levels – $19,700, $20,000 and $20,500.
Bitcoin price is slowly moving higher above $19,500 against the US Dollar. BTC could start a steady increase if there is a close above $19,600 and $20,000.
Bitcoin remained well bid above the $19,200 and $19,000 support levels.
The price is trading above $19,400 and the 100 hourly simple moving average.
There is a key bullish trend line forming with support near $19,450 on the hourly chart of the BTC/USD pair (data feed from Kraken).
The pair could start a steady increase if there is a clear move above the $19,700 level.
Bitcoin price remained strong above the $19,000 level. BTC traded as low as $18,937 and started a steady increase. There was a move above the $19,150 and $19200 levels.
The price was able to clear the 50% Fib retracement level of the downward move from the $20,177 swing high to $18,937 low. There was a also a move above the $19,500 resistance zone to move into a short-term positive zone.
Bitcoin price is now trading above $19,400 and the 100 hourly simple moving average. There is also a key bullish trend line forming with support near $19,450 on the hourly chart of the BTC/USD pair.
On the upside, an immediate resistance is near the $19,700 level. It is near the 61.8% Fib retracement level of the downward move from the $20,177 swing high to $18,937 low. The next major resistance sits near the $20,000 zone.
Source: BTCUSD on TradingView.com
A clear move above the $20,0000 resistance might start a fresh increase. In the stated case, the price could even surpass the $20,200 resistance zone. The next major resistance is near the $20,500 zone.
If bitcoin fails to rise above the $19,700 resistance zone, it could start a fresh decline. An immediate support on the downside is near the $19,400 zone.
The next major support is near the $19,000 zone. The main support is near $18,500, below which there could be a major decline. In the stated case, the price may perhaps decline towards the $17,500 support.
Technical indicators:
Hourly MACD – The MACD is now gaining pace in the bullish zone.
Hourly RSI (Relative Strength Index) – The RSI for BTC/USD is now above the 50 level.
Major Support Levels – $19,400, followed by $19,200.
Major Resistance Levels – $19,700, $20,000 and $20,500.
Tags: bitcoinbtcusdBTCUSDTxbtusd
NewsBTCRead More
Data shows the Bitcoin Fear & Greed Index has marked an improvement after the latest…
Bitcoin Magazine Eric Trump Confirmed As Speaker For Bitcoin 2026 Conference Bitcoin Magazine has confirmed…
Bitcoin Magazine Bitcoin’s Ownership Base is Maturing, Reducing Reliance on Retail: Analysts Bitcoin investors have…
“The wildest thing about my $1 million prediction is that it's not wild at all,”…
Wall Street broker Bernstein took note of an institutional ownership shift as behind bitcoin's resilience…
Gains came for crypto and stocks as tensions around the Strait of Hormuz appeared to…