Bitcoin gained pace above the $39,000 resistance against the US Dollar. BTC even tested $40,000 and might continue to rise in the near term.
Bitcoin started a decent increase above the $38,800 and $39,000 resistance levels.
The price is now trading above $39,000 and the 100 hourly simple moving average.
There was a break above a major bearish trend line with resistance near $38,475 on the hourly chart of the BTC/USD pair (data feed from Kraken).
The pair might attempt more upsides above the $40,000 and $40,300 levels.
Bitcoin Price Breaks Higher
Bitcoin price formed a strong base above the $37,500 level. BTC started a steady increase and was able to clear the $38,500 resistance zone.
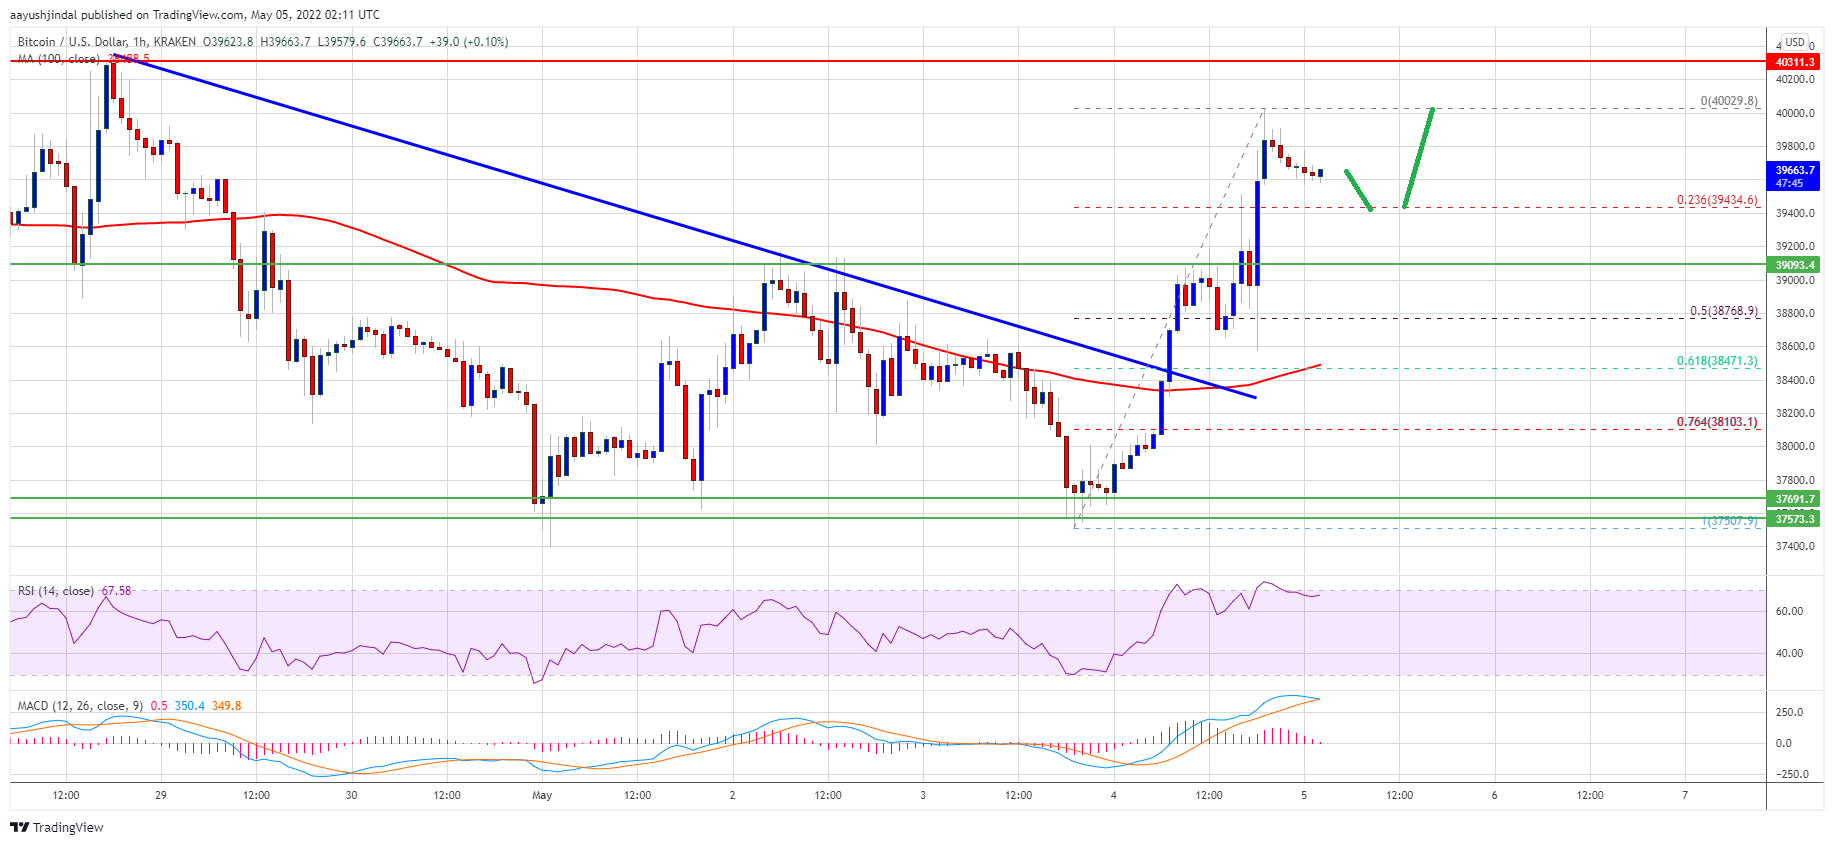
There was a break above a major bearish trend line with resistance near $38,475 on the hourly chart of the BTC/USD pair. The pair settled above the $39,000 and the 100 hourly simple moving average. Finally, there was a spike above the $40,000 resistance zone.
A high is formed near $40,029 and the price is now consolidating gains. It is trading well above the 23.6% Fib retracement level of the recent wave from the $37,507 swing low to $40,029 high.
Source: BTCUSD on TradingView.com
On the upside, bitcoin price is now facing resistance near the $40,000 level. The next key resistance could be near the $40,300 zone. A close above the $40,300 resistance could lift the market sentiment. In the stated case, the price could rise steadily towards the $41,000 level. The next major resistance is near $41,500.
Dips Supported in BTC?
If bitcoin fails to clear the $40,000 resistance zone, it could start a downside correction. An immediate support on the downside is near the $39,500 level. The next major support is seen near the $39,000 level (the recent breakout zone).
Any more losses might call for a test of the 50% Fib retracement level of the recent wave from the $37,507 swing low to $40,029 high. A downside break below the $38,750 support might put pressure on the bulls in the short-term. The next major support is $38,500 and the 100 hourly simple moving average.
Technical indicators:
Hourly MACD – The MACD is slowly losing pace in the bullish zone.
Hourly RSI (Relative Strength Index) – The RSI for BTC/USD is now well above the 60 level.
Major Support Levels – $39,500, followed by $39,000.
Major Resistance Levels – $40,000, $40,300 and $41,000.
Bitcoin gained pace above the $39,000 resistance against the US Dollar. BTC even tested $40,000 and might continue to rise in the near term.
Bitcoin started a decent increase above the $38,800 and $39,000 resistance levels.
The price is now trading above $39,000 and the 100 hourly simple moving average.
There was a break above a major bearish trend line with resistance near $38,475 on the hourly chart of the BTC/USD pair (data feed from Kraken).
The pair might attempt more upsides above the $40,000 and $40,300 levels.
Bitcoin price formed a strong base above the $37,500 level. BTC started a steady increase and was able to clear the $38,500 resistance zone.
There was a break above a major bearish trend line with resistance near $38,475 on the hourly chart of the BTC/USD pair. The pair settled above the $39,000 and the 100 hourly simple moving average. Finally, there was a spike above the $40,000 resistance zone.
A high is formed near $40,029 and the price is now consolidating gains. It is trading well above the 23.6% Fib retracement level of the recent wave from the $37,507 swing low to $40,029 high.
Source: BTCUSD on TradingView.com
On the upside, bitcoin price is now facing resistance near the $40,000 level. The next key resistance could be near the $40,300 zone. A close above the $40,300 resistance could lift the market sentiment. In the stated case, the price could rise steadily towards the $41,000 level. The next major resistance is near $41,500.
If bitcoin fails to clear the $40,000 resistance zone, it could start a downside correction. An immediate support on the downside is near the $39,500 level. The next major support is seen near the $39,000 level (the recent breakout zone).
Any more losses might call for a test of the 50% Fib retracement level of the recent wave from the $37,507 swing low to $40,029 high. A downside break below the $38,750 support might put pressure on the bulls in the short-term. The next major support is $38,500 and the 100 hourly simple moving average.
Technical indicators:
Hourly MACD – The MACD is slowly losing pace in the bullish zone.
Hourly RSI (Relative Strength Index) – The RSI for BTC/USD is now well above the 60 level.
Major Support Levels – $39,500, followed by $39,000.
Major Resistance Levels – $40,000, $40,300 and $41,000.
Tags: bitcoinbtcusdBTCUSDTxbtusd
FeedzyRead More
A potential US military strike on Iran’s main oil export terminal helped push Bitcoin to…
Bitcoin Magazine Bitcoin Price Surges Above $75,000 as Bullish Momentum Builds The bitcoin price climbed…
The alleged theft of 2,323 bitcoin has triggered a High Court dispute testing how English…
Bitcoin Magazine Bitcoin at Key Support Levels — Why Jack Mallers Says Turn On DCA…
Data shows the Bitcoin Fear & Greed Index has marked an improvement after the latest…
Bitcoin Magazine Eric Trump Confirmed As Speaker For Bitcoin 2026 Conference Bitcoin Magazine has confirmed…