Bitcoin declined heavily below the $22,000 support zone against the US Dollar. BTC is correcting gains, but upsides might be limited above the $22,500 resistance.
Bitcoin extended losses and declined below the $22,000 support.
The price is now trading below the $22,000 level and the 100 hourly simple moving average.
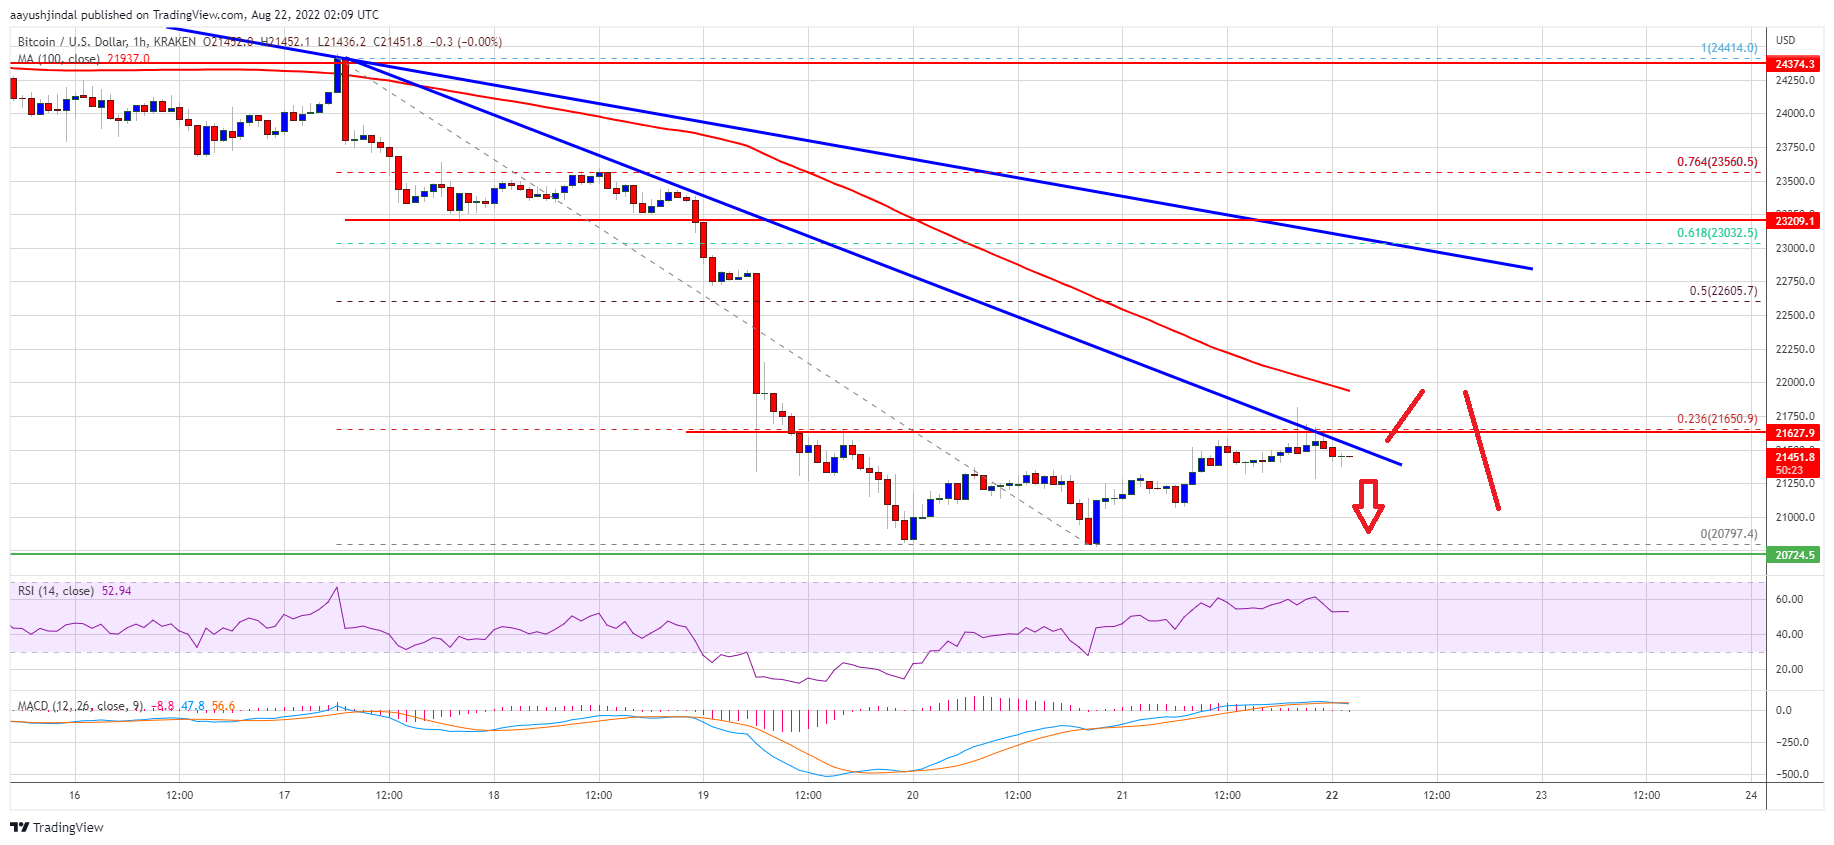
There is a major bearish trend line forming with resistance near $21,550 on the hourly chart of the BTC/USD pair (data feed from Kraken).
The pair could extend losses if it stays below the $21,500 and $22,000 levels.
Bitcoin Price Dives over 8%
Bitcoin price started a major decline below the $23,000 support zone. BTC gained bearish momentum below the $22,500 and $22,200 support levels.
The decline was such that the price settled below the $22,000 support zone. It even spiked below the $21,000 level and traded as low as $20,797. The price is now correcting losses above the $21,000 level. It is now trading below the $22,000 level and the 100 hourly simple moving average.
Recently, there was a push above the $21,250 level. However, bitcoin price struggled near the 23.6% Fib retracement level of the recent decline from the $24,414 swing high to $20,797 low.
On the upside, an immediate resistance is near the $21,500 level. There is also a major bearish trend line forming with resistance near $21,550 on the hourly chart of the BTC/USD pair. The first major resistance on the upside sits near the $22,000 level and the 100 hourly simple moving average.
Source: BTCUSD on TradingView.com
The main resistance is forming near the $22,650 zone. It is near the 50% Fib retracement level of the recent decline from the $24,414 swing high to $20,797 low. A close above the $22,500 and $22,650 resistance levels might start another increase.
More Losses in BTC?
If bitcoin fails to clear the $22,000 resistance zone, it could continue to move down. An immediate support on the downside is near the $21,250 level.
The next major support now sits near the $20,800 level. A downside break and close below the $20,800 level might spark another sharp decline. In the stated case, the price might decline towards the $20,000 level.
Technical indicators:
Hourly MACD – The MACD is now gaining pace in the bearish zone.
Hourly RSI (Relative Strength Index) – The RSI for BTC/USD is now above the 50 level.
Major Support Levels – $21,250, followed by $20,800.
Major Resistance Levels – $21,550, $22,000 and $22,650.
Bitcoin declined heavily below the $22,000 support zone against the US Dollar. BTC is correcting gains, but upsides might be limited above the $22,500 resistance.
Bitcoin extended losses and declined below the $22,000 support.
The price is now trading below the $22,000 level and the 100 hourly simple moving average.
There is a major bearish trend line forming with resistance near $21,550 on the hourly chart of the BTC/USD pair (data feed from Kraken).
The pair could extend losses if it stays below the $21,500 and $22,000 levels.
Bitcoin price started a major decline below the $23,000 support zone. BTC gained bearish momentum below the $22,500 and $22,200 support levels.
The decline was such that the price settled below the $22,000 support zone. It even spiked below the $21,000 level and traded as low as $20,797. The price is now correcting losses above the $21,000 level. It is now trading below the $22,000 level and the 100 hourly simple moving average.
Recently, there was a push above the $21,250 level. However, bitcoin price struggled near the 23.6% Fib retracement level of the recent decline from the $24,414 swing high to $20,797 low.
On the upside, an immediate resistance is near the $21,500 level. There is also a major bearish trend line forming with resistance near $21,550 on the hourly chart of the BTC/USD pair. The first major resistance on the upside sits near the $22,000 level and the 100 hourly simple moving average.
Source: BTCUSD on TradingView.com
The main resistance is forming near the $22,650 zone. It is near the 50% Fib retracement level of the recent decline from the $24,414 swing high to $20,797 low. A close above the $22,500 and $22,650 resistance levels might start another increase.
If bitcoin fails to clear the $22,000 resistance zone, it could continue to move down. An immediate support on the downside is near the $21,250 level.
The next major support now sits near the $20,800 level. A downside break and close below the $20,800 level might spark another sharp decline. In the stated case, the price might decline towards the $20,000 level.
Technical indicators:
Hourly MACD – The MACD is now gaining pace in the bearish zone.
Hourly RSI (Relative Strength Index) – The RSI for BTC/USD is now above the 50 level.
Major Support Levels – $21,250, followed by $20,800.
Major Resistance Levels – $21,550, $22,000 and $22,650.
Tags: bitcoinbtcusdBTCUSDTxbtusd
NewsBTCRead More
Bitcoin Magazine Bitcoin’s Bear Market Is Over, Galaxy Says Galaxy Research believes bitcoin’s bear market…
▶ Bitcoin Magazine Bitcoin Treasury Analyst: MSTR, ASST & Metaplanet Digital Credit Outlook Metaplanet couldn’t…
▶ Bitcoin Magazine PHP Hack: How Bitcoin Will Respond to the “Cyber Pandemic” Government websites…
▶ Bitcoin Magazine The Bitcoin vs. Nasdaq Signal Has Flipped Bullish Tech stocks are selling…
▶ Bitcoin Magazine Blockstream Executive Peter Bain: Institutional Clients Say Bitcoin “Poised for a Big…
▶ Bitcoin Magazine Leon Wankum: The Insane Math Behind Bitcoin Demonetizing Real Estate Real estate…