Bitcoin started an upside correction from the $18,223 low against the US Dollar. BTC climbed above $19,000, but it is now facing resistance near the 100 hourly SMA.
Bitcoin traded as low as $18,223 before it started an upside correction.
The price is still trading below $20,000 and the 100 hourly simple moving average.
There is a key bearish trend line forming with resistance near $19,650 on the hourly chart of the BTC/USD pair (data feed from Kraken).
The pair must clear the trend line and the 100 hourly SMA to continue higher towards $20,500.
Bitcoin Price Recovers Above $19,000
Bitcoin price extended losses after it settled below the $19,000 level. BTC broke the $18,500 support zone and traded as low as $18,223.
There was no test of the $18,000 zone and the price started an upside correction. There was a steady increase above the $18,500 and $18,800 levels. The price was able to clear the 50% Fib retracement level of the downward move from the $20,198 swing high to $18,223 low.
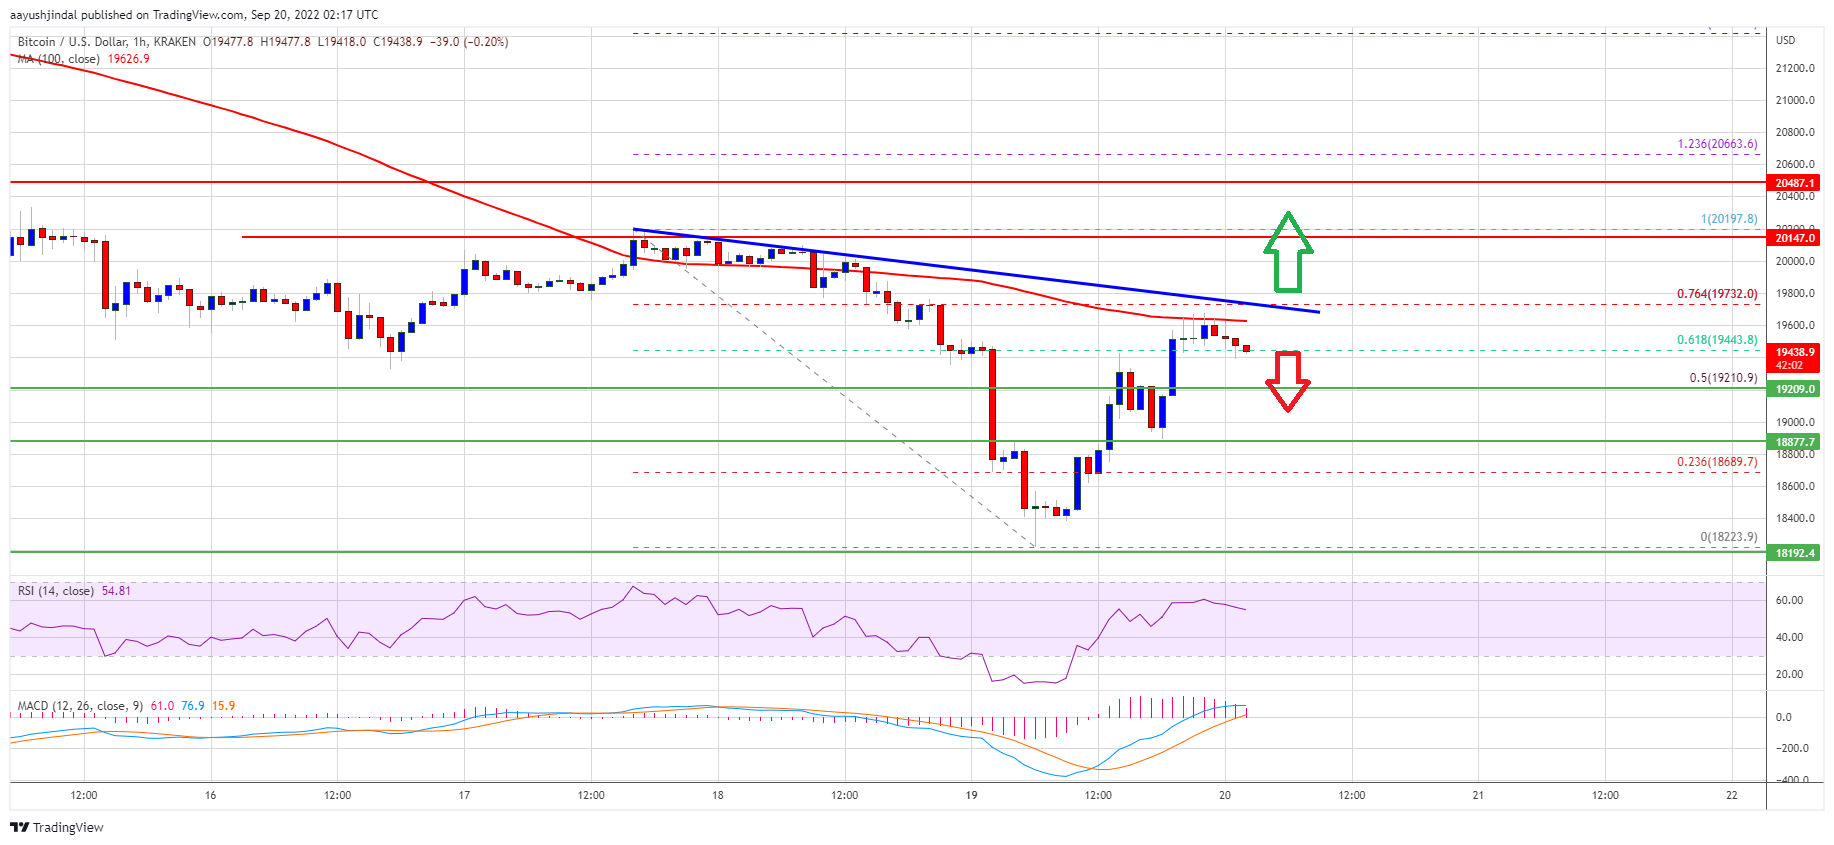
Bitcoin price even spiked above the $19,500 resistance zone. However, the bears were active near the $19,600 level and the 100 hourly simple moving average.
There is also a key bearish trend line forming with resistance near $19,650 on the hourly chart of the BTC/USD pair. The trend line is near the 76.4% Fib retracement level of the downward move from the $20,198 swing high to $18,223 low.
Source: BTCUSD on TradingView.com
On the upside, an immediate resistance is near the $19,600 level and the trend line. The next major resistance sits near the $20,000 level. Any more gains might send the price towards the $20,500 resistance zone. Furthermore, if the bulls remain in action, the price could test $21,200.
Fresh Decline in BTC?
If bitcoin fails to continue higher above the $19,600 resistance zone, it could start a fresh decline. An immediate support on the downside is near the $19,200 zone.
The next major support is near the $18,850 level. A clear move below the $18,850 and $18,800 levels might open the doors for a move towards the $18,223 low or even to a new low.
Technical indicators:
Hourly MACD – The MACD is now losing pace in the bullish zone.
Hourly RSI (Relative Strength Index) – The RSI for BTC/USD is now above the 50 level.
Major Support Levels – $19,200, followed by $18,850.
Major Resistance Levels – $19,600, $19,650 and $20,500.
Bitcoin started an upside correction from the $18,223 low against the US Dollar. BTC climbed above $19,000, but it is now facing resistance near the 100 hourly SMA.
Bitcoin traded as low as $18,223 before it started an upside correction.
The price is still trading below $20,000 and the 100 hourly simple moving average.
There is a key bearish trend line forming with resistance near $19,650 on the hourly chart of the BTC/USD pair (data feed from Kraken).
The pair must clear the trend line and the 100 hourly SMA to continue higher towards $20,500.
Bitcoin price extended losses after it settled below the $19,000 level. BTC broke the $18,500 support zone and traded as low as $18,223.
There was no test of the $18,000 zone and the price started an upside correction. There was a steady increase above the $18,500 and $18,800 levels. The price was able to clear the 50% Fib retracement level of the downward move from the $20,198 swing high to $18,223 low.
Bitcoin price even spiked above the $19,500 resistance zone. However, the bears were active near the $19,600 level and the 100 hourly simple moving average.
There is also a key bearish trend line forming with resistance near $19,650 on the hourly chart of the BTC/USD pair. The trend line is near the 76.4% Fib retracement level of the downward move from the $20,198 swing high to $18,223 low.
Source: BTCUSD on TradingView.com
On the upside, an immediate resistance is near the $19,600 level and the trend line. The next major resistance sits near the $20,000 level. Any more gains might send the price towards the $20,500 resistance zone. Furthermore, if the bulls remain in action, the price could test $21,200.
If bitcoin fails to continue higher above the $19,600 resistance zone, it could start a fresh decline. An immediate support on the downside is near the $19,200 zone.
The next major support is near the $18,850 level. A clear move below the $18,850 and $18,800 levels might open the doors for a move towards the $18,223 low or even to a new low.
Technical indicators:
Hourly MACD – The MACD is now losing pace in the bullish zone.
Hourly RSI (Relative Strength Index) – The RSI for BTC/USD is now above the 50 level.
Major Support Levels – $19,200, followed by $18,850.
Major Resistance Levels – $19,600, $19,650 and $20,500.
Tags: bitcoinbtcusdBTCUSDTxbtusd
NewsBTCRead More
U.S. spot bitcoin ETFs lost $2.97 billion across 10 trading days through Friday, the longest…
Bitcoin price started a fresh decline below the $73,800 zone. BTC is consolidating and might…
The creator of the Mayer Multiple argues bitcoin’s growing economic substance is compressing volatility and…
Prominent crypto analysis page XWIN Research Japan reports that Bitcoin has reached a new milestone:…
Bitcoin’s market cap has dropped to roughly $1.46 trillion, pushing it below several major technology…
Bitcoin’s return to $100,000 is still a popular target across the market for 2026, but…