Bitcoin settled below the $21,000 support zone against the US Dollar. BTC is showing bearish signs and remains at a risk of a major breakdown below $20,000.
Bitcoin struggled to correct higher and stayed below the $21,000 resistance zone.
The price is now trading below $20,750 and the 100 hourly simple moving average.
There is a key bearish trend line forming with resistance near $20,250 on the hourly chart of the BTC/USD pair (data feed from Kraken).
The pair is consolidating above the $20,000 level and might start another decline.
Bitcoin Price Faces Sellers
Bitcoin price remained in a bearish zone below the $21,000 level. There was a short-term recovery wave, but the bears were active near the $20,300 and $20,350 levels.
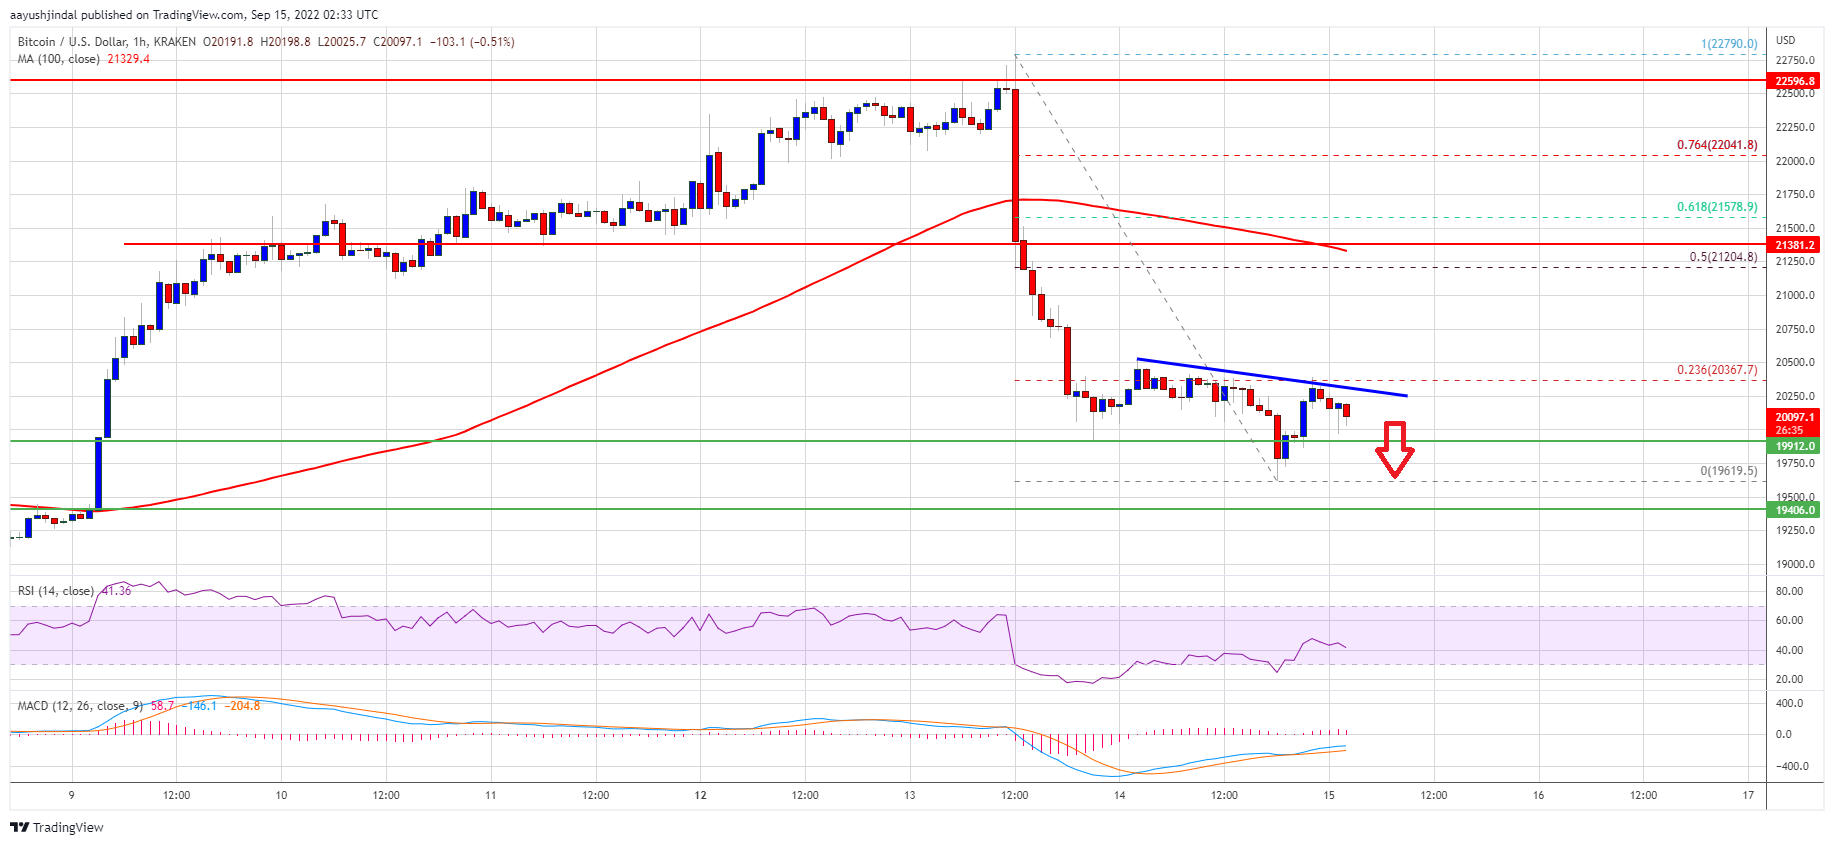
The price started a fresh decline and traded below the $20,000 level. It even broke the recent swing low and traded to a new weekly low at $19,619. The price is now trading below $20,750 and the 100 hourly simple moving average.
There is also a key bearish trend line forming with resistance near $20,250 on the hourly chart of the BTC/USD pair. On the upside, an immediate resistance is near the $20,300 level. It is near the 23.6% Fib retracement level of the key drop from the $22,790 swing high to $19,619 low.
A clear move above the trend line and $20,300 might send the price towards the $20,750 resistance. The next major resistance sits near the $21,200 level. It coincides with the 50% Fib retracement level of the key drop from the $22,790 swing high to $19,619 low.
Source: BTCUSD on TradingView.com
A close above the $21,200 resistance might start a fresh increase. In the stated case, the price may perhaps rise towards $22,000. Any more gains might send the price towards the $22,450 resistance zone.
More Losses in BTC?
If bitcoin fails to clear the $20,300 resistance zone, it could continue to move down. An immediate support on the downside is near the $20,000 zone.
The next major support is near the $19,600 and $19,500 levels. A downside break below the $19,500 level might send the price towards the $18,500 support.
Technical indicators:
Hourly MACD – The MACD is now gaining pace in the bearish zone.
Hourly RSI (Relative Strength Index) – The RSI for BTC/USD is now below the 50 level.
Major Support Levels – $20,000, followed by $19,500.
Major Resistance Levels – $20,300, $20,750 and $21,200.
Bitcoin settled below the $21,000 support zone against the US Dollar. BTC is showing bearish signs and remains at a risk of a major breakdown below $20,000.
Bitcoin struggled to correct higher and stayed below the $21,000 resistance zone.
The price is now trading below $20,750 and the 100 hourly simple moving average.
There is a key bearish trend line forming with resistance near $20,250 on the hourly chart of the BTC/USD pair (data feed from Kraken).
The pair is consolidating above the $20,000 level and might start another decline.
Bitcoin price remained in a bearish zone below the $21,000 level. There was a short-term recovery wave, but the bears were active near the $20,300 and $20,350 levels.
The price started a fresh decline and traded below the $20,000 level. It even broke the recent swing low and traded to a new weekly low at $19,619. The price is now trading below $20,750 and the 100 hourly simple moving average.
There is also a key bearish trend line forming with resistance near $20,250 on the hourly chart of the BTC/USD pair. On the upside, an immediate resistance is near the $20,300 level. It is near the 23.6% Fib retracement level of the key drop from the $22,790 swing high to $19,619 low.
A clear move above the trend line and $20,300 might send the price towards the $20,750 resistance. The next major resistance sits near the $21,200 level. It coincides with the 50% Fib retracement level of the key drop from the $22,790 swing high to $19,619 low.
Source: BTCUSD on TradingView.com
A close above the $21,200 resistance might start a fresh increase. In the stated case, the price may perhaps rise towards $22,000. Any more gains might send the price towards the $22,450 resistance zone.
If bitcoin fails to clear the $20,300 resistance zone, it could continue to move down. An immediate support on the downside is near the $20,000 zone.
The next major support is near the $19,600 and $19,500 levels. A downside break below the $19,500 level might send the price towards the $18,500 support.
Technical indicators:
Hourly MACD – The MACD is now gaining pace in the bearish zone.
Hourly RSI (Relative Strength Index) – The RSI for BTC/USD is now below the 50 level.
Major Support Levels – $20,000, followed by $19,500.
Major Resistance Levels – $20,300, $20,750 and $21,200.
Tags: bitcoinbtcusdBTCUSDTxbtusd
NewsBTCRead More
Veteran trader Peter Brandt sparked a fresh round of chart debate around Bitcoin after posting…
Majors posted broad gains on Monday as oil eased from highs, two tankers sailed through…
Volume jumped more than 250% during the move, with traders watching whether former resistance now…
Bitcoin's convincing move above its key average indicates a strengthening of the bullish momentum.Read MoreCoinDesk:…
Bitcoin price started a steady increase above the $72,000 zone. BTC is now consolidating and…
The crypto market’s fear gauge hit 15 — deep inside “Extreme Fear” territory — yet…