Bitcoin is gaining bullish momentum above $24,500 against the US Dollar. BTC could gain bullish momentum if it clears the $25,000 resistance zone.
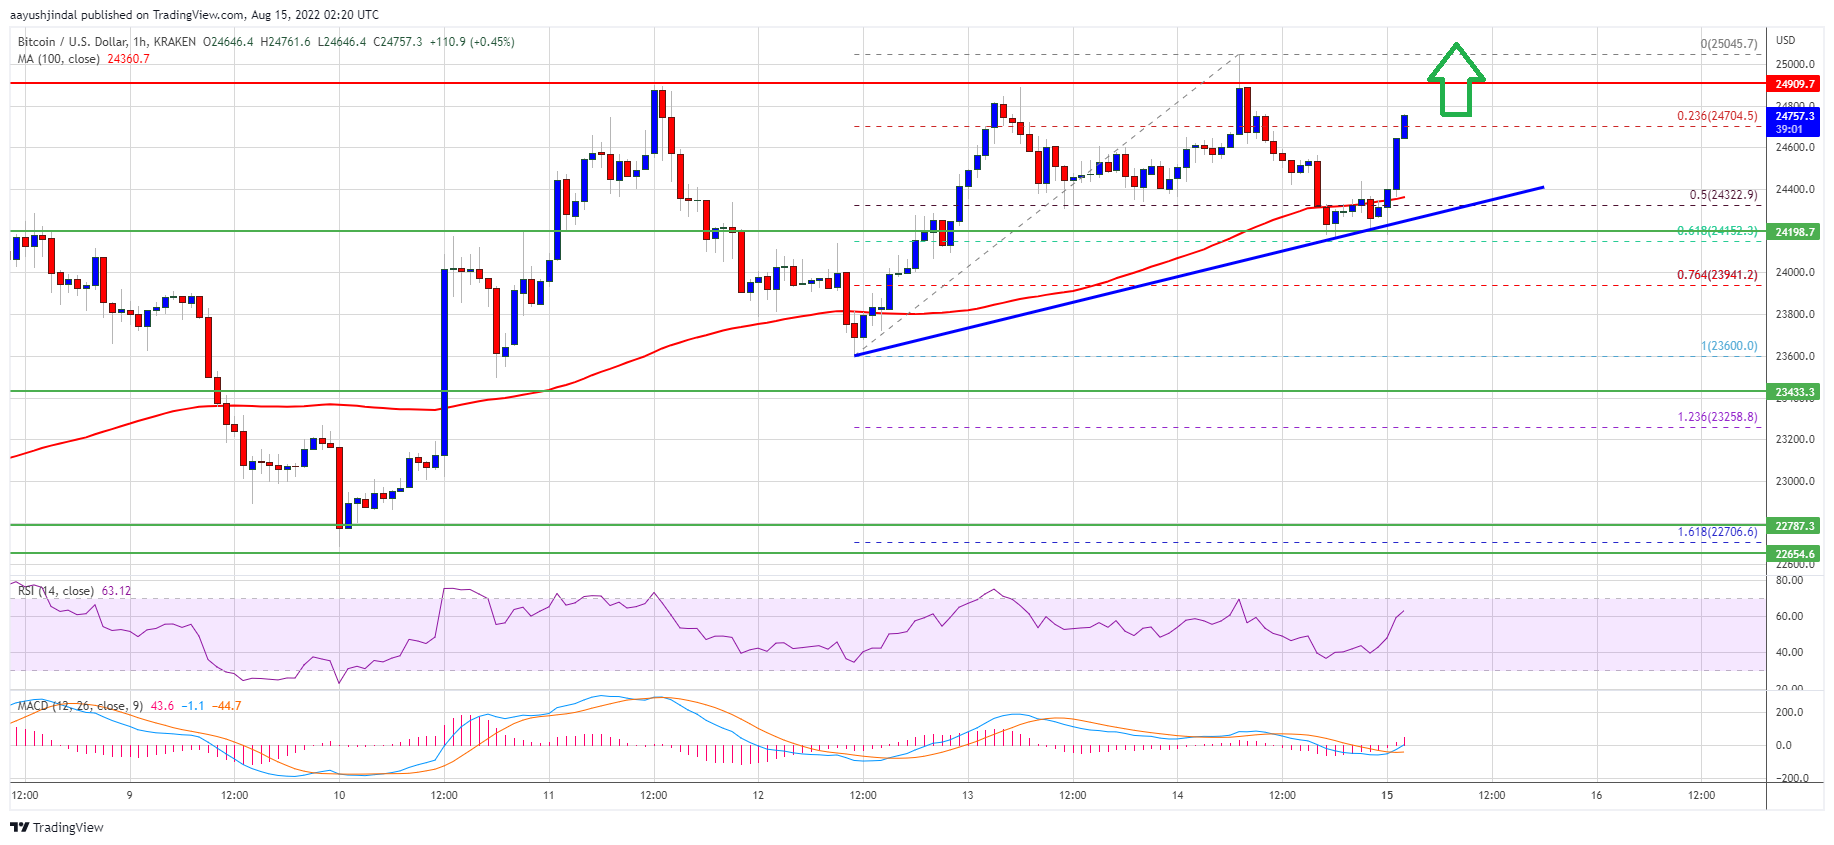
Bitcoin started a fresh increase above the $24,200 resistance zone.
The price is now trading above the $24,000 level and the 100 hourly simple moving average.
There is a key bullish trend line forming with support near $24,400 on the hourly chart of the BTC/USD pair (data feed from Kraken).
The pair could gain bullish momentum if there is a clear move above the $25,000 resistance.
Bitcoin Price Gains Momentum
Bitcoin price attempted a fresh increase above the $24,500 resistance zone. BTC gained pace for a move above the $24,800 level, with a close above the 100 hourly simple moving average.
The price even spiked above the $25,000 level. A high was formed near $25,045 before there was a downside correction. There was a move below the $24,500 support level. The price declined below the 50% Fib retracement level of the upward move from the $23,600 swing low to $25,045 high.
However, the bulls were active near a key support at $24,200. The 61.8% Fib retracement level of the upward move from the $23,600 swing low to $25,045 high acted as a support.
There is also a key bullish trend line forming with support near $24,400 on the hourly chart of the BTC/USD pair. Bitcoin price is now trading above the $24,000 level and the 100 hourly simple moving average.
Source: BTCUSD on TradingView.com
On the upside, an immediate resistance is near the $24,800 level. The next key resistance is near the $25,000 zone. A close above the $25,000 resistance zone could start another increase. In the stated case, the price may perhaps test the $25,800 resistance. Any more gains might send the price towards the $26,200 level.
Dips Supported in BTC?
If bitcoin fails to clear the $25,000 resistance zone, it could start a downside correction. An immediate support on the downside is near the $24,600 level.
The next major support now sits near the $24,500 level, the trend line, and the 100 hourly SMA. If the bears push the price below the $24,500 support level, there might be a move towards the $24,200 level. Any more losses might send the price towards $23,500 level.
Technical indicators:
Hourly MACD – The MACD is now gaining pace in the bullish zone.
Hourly RSI (Relative Strength Index) – The RSI for BTC/USD is now above the 50 level.
Major Support Levels – $24,500, followed by $24,200.
Major Resistance Levels – $25,000, $25,800 and $26,200.
Bitcoin is gaining bullish momentum above $24,500 against the US Dollar. BTC could gain bullish momentum if it clears the $25,000 resistance zone.
Bitcoin started a fresh increase above the $24,200 resistance zone.
The price is now trading above the $24,000 level and the 100 hourly simple moving average.
There is a key bullish trend line forming with support near $24,400 on the hourly chart of the BTC/USD pair (data feed from Kraken).
The pair could gain bullish momentum if there is a clear move above the $25,000 resistance.
Bitcoin price attempted a fresh increase above the $24,500 resistance zone. BTC gained pace for a move above the $24,800 level, with a close above the 100 hourly simple moving average.
The price even spiked above the $25,000 level. A high was formed near $25,045 before there was a downside correction. There was a move below the $24,500 support level. The price declined below the 50% Fib retracement level of the upward move from the $23,600 swing low to $25,045 high.
However, the bulls were active near a key support at $24,200. The 61.8% Fib retracement level of the upward move from the $23,600 swing low to $25,045 high acted as a support.
There is also a key bullish trend line forming with support near $24,400 on the hourly chart of the BTC/USD pair. Bitcoin price is now trading above the $24,000 level and the 100 hourly simple moving average.
Source: BTCUSD on TradingView.com
On the upside, an immediate resistance is near the $24,800 level. The next key resistance is near the $25,000 zone. A close above the $25,000 resistance zone could start another increase. In the stated case, the price may perhaps test the $25,800 resistance. Any more gains might send the price towards the $26,200 level.
If bitcoin fails to clear the $25,000 resistance zone, it could start a downside correction. An immediate support on the downside is near the $24,600 level.
The next major support now sits near the $24,500 level, the trend line, and the 100 hourly SMA. If the bears push the price below the $24,500 support level, there might be a move towards the $24,200 level. Any more losses might send the price towards $23,500 level.
Technical indicators:
Hourly MACD – The MACD is now gaining pace in the bullish zone.
Hourly RSI (Relative Strength Index) – The RSI for BTC/USD is now above the 50 level.
Major Support Levels – $24,500, followed by $24,200.
Major Resistance Levels – $25,000, $25,800 and $26,200.
Tags: bitcoinbtcusdBTCUSDTxbtusd
NewsBTCRead More
A prominent crypto analyst is pointing to similarities between Cardano’s current market position and Bitcoin’s…
Bitcoin price started a fresh decline from the $69,250 zone. BTC is now struggling to…
The ongoing tensions in the Middle East continue to put immense pressure on Bitcoin and…
Bitcoin Magazine MARA Conducts Ongoing Layoffs Following $1.1B Bitcoin Sale and Debt Reduction Push Bitcoin…
Crypto analyst Minga has predicted that the Bitcoin price could rally past $120,000 to a…
The negative gamma zone below $68,000 can trigger a self-reinforcing sell-off, leading to an ever…