Bitcoin extended decline and tested the $38,200 zone against the US Dollar. BTC started a major recovery wave and climbed above the $40,000 resistance.
Bitcoin extended decline, but it remained stable above the $38,000 level.
The price is now back above below $40,000 and the 100 hourly simple moving average.
There was a break above a major bearish trend line with resistance near $39,550 on the hourly chart of the BTC/USD pair (data feed from Kraken).
The pair is eyeing more upsides above the $40,500 and $40,950 resistance levels.
Bitcoin Price Recovers Sharply
Bitcoin price remained in a bearish zone after it broke the $39,200 support. BTC extended decline below the $38,500 level, but the bulls were active near the $38,200 level.
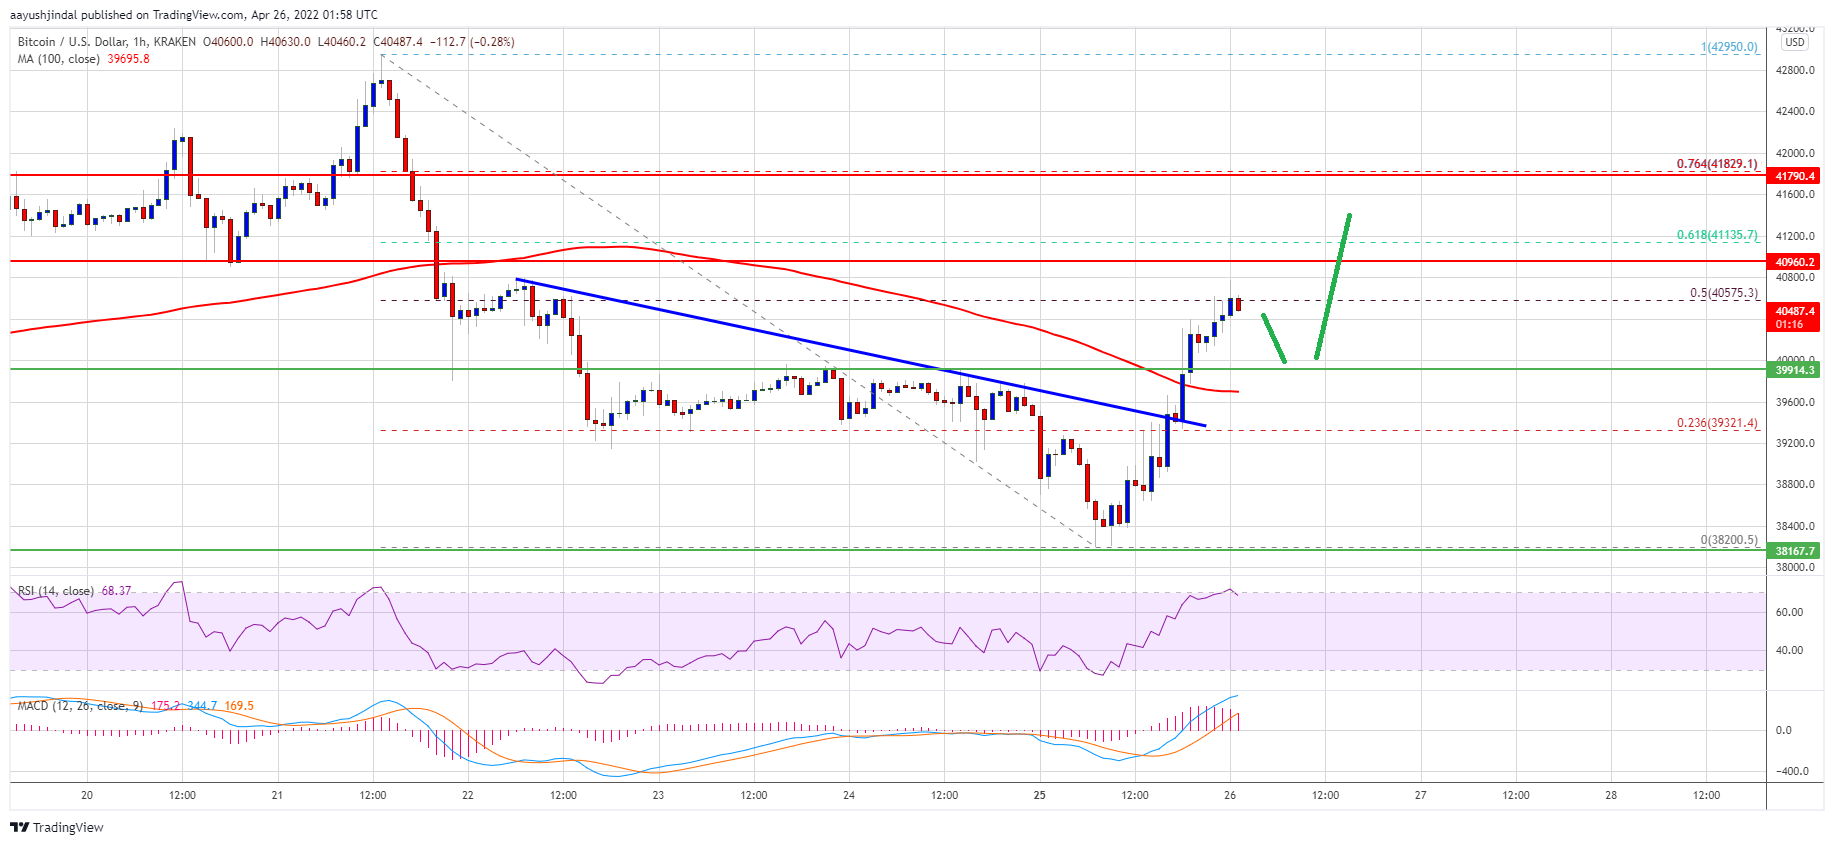
A low was formed near $38,200 and the price started a major increase. The price climbed higher above the $39,200 and $39,500 resistance levels. There was a move above the 23.6% Fib retracement level of the key decline from the $42,950 swing high to $38,200 low.
Besides, there was a break above a major bearish trend line with resistance near $39,550 on the hourly chart of the BTC/USD pair. Bitcoin is now back above below $40,000 and the 100 hourly simple moving average.
An immediate resistance on the upside is near the $40,550 level. It is near the 50% Fib retracement level of the key decline from the $42,950 swing high to $38,200 low. The next key resistance could be $40,950. If there is a clear move above the $40,950 and $41,000 levels, the price could continue to rise.
Source: BTCUSD on TradingView.com
In the stated case, the price could even surpass the $41,200 resistance. The next major resistance may perhaps be near the $41,800 zone.
Dips Supported in BTC?
If bitcoin fails to clear the $41,000 resistance zone, it could start a downside correction. An immediate support on the downside is near the $40,000 level.
The next major support is seen near the $39,800 level and the 100 hourly simple moving average. A close below the $39,800 support zone might start another decline. In the stated case, the price might decline to $39,000.
Technical indicators:
Hourly MACD – The MACD is slowly gaining pace in the bullish zone.
Hourly RSI (Relative Strength Index) – The RSI for BTC/USD is now well above the 50 level.
Major Support Levels – $40,000, followed by $39,800.
Major Resistance Levels – $40,550, $40,950 and $41,800.
Bitcoin extended decline and tested the $38,200 zone against the US Dollar. BTC started a major recovery wave and climbed above the $40,000 resistance.
Bitcoin extended decline, but it remained stable above the $38,000 level.
The price is now back above below $40,000 and the 100 hourly simple moving average.
There was a break above a major bearish trend line with resistance near $39,550 on the hourly chart of the BTC/USD pair (data feed from Kraken).
The pair is eyeing more upsides above the $40,500 and $40,950 resistance levels.
Bitcoin price remained in a bearish zone after it broke the $39,200 support. BTC extended decline below the $38,500 level, but the bulls were active near the $38,200 level.
A low was formed near $38,200 and the price started a major increase. The price climbed higher above the $39,200 and $39,500 resistance levels. There was a move above the 23.6% Fib retracement level of the key decline from the $42,950 swing high to $38,200 low.
Besides, there was a break above a major bearish trend line with resistance near $39,550 on the hourly chart of the BTC/USD pair. Bitcoin is now back above below $40,000 and the 100 hourly simple moving average.
An immediate resistance on the upside is near the $40,550 level. It is near the 50% Fib retracement level of the key decline from the $42,950 swing high to $38,200 low. The next key resistance could be $40,950. If there is a clear move above the $40,950 and $41,000 levels, the price could continue to rise.
Source: BTCUSD on TradingView.com
In the stated case, the price could even surpass the $41,200 resistance. The next major resistance may perhaps be near the $41,800 zone.
If bitcoin fails to clear the $41,000 resistance zone, it could start a downside correction. An immediate support on the downside is near the $40,000 level.
The next major support is seen near the $39,800 level and the 100 hourly simple moving average. A close below the $39,800 support zone might start another decline. In the stated case, the price might decline to $39,000.
Technical indicators:
Hourly MACD – The MACD is slowly gaining pace in the bullish zone.
Hourly RSI (Relative Strength Index) – The RSI for BTC/USD is now well above the 50 level.
Major Support Levels – $40,000, followed by $39,800.
Major Resistance Levels – $40,550, $40,950 and $41,800.
Tags: bitcoinbtcusdBTCUSDTxbtusd
FeedzyRead More
The company's stack now stands at 761,068 bitcoin, acquired for $57.61 billion.Read MoreCoinDesk: Bitcoin, Ethereum,…
The Japanese bitcoin treasury firm structured the financing with premium-priced shares and warrants that could…
At the time of writing, Bitcoin (BTC) trades in the highs $73,000, outperforming both equities…
Bitcoin Magazine Strategy (MSTR) Spends $1.57 Billion to Buy 22,337 More Bitcoin, Holdings Reach 738,731…
Your day-ahead look for March 16, 2026Read MoreCoinDesk: Bitcoin, Ethereum, Crypto News and Price Data[#item_full_content]
The Bitcoin and Ethereum prices continue to struggle, with BTC dropping to as low as…